Native/Alaskan vs Marshallese Receiving Food Stamps
COMPARE
Native/Alaskan
Marshallese
Receiving Food Stamps
Receiving Food Stamps Comparison
Natives/Alaskans
Marshallese
17.3%
RECEIVING FOOD STAMPS
0.0/ 100
METRIC RATING
321st/ 347
METRIC RANK
14.1%
RECEIVING FOOD STAMPS
0.3/ 100
METRIC RATING
254th/ 347
METRIC RANK
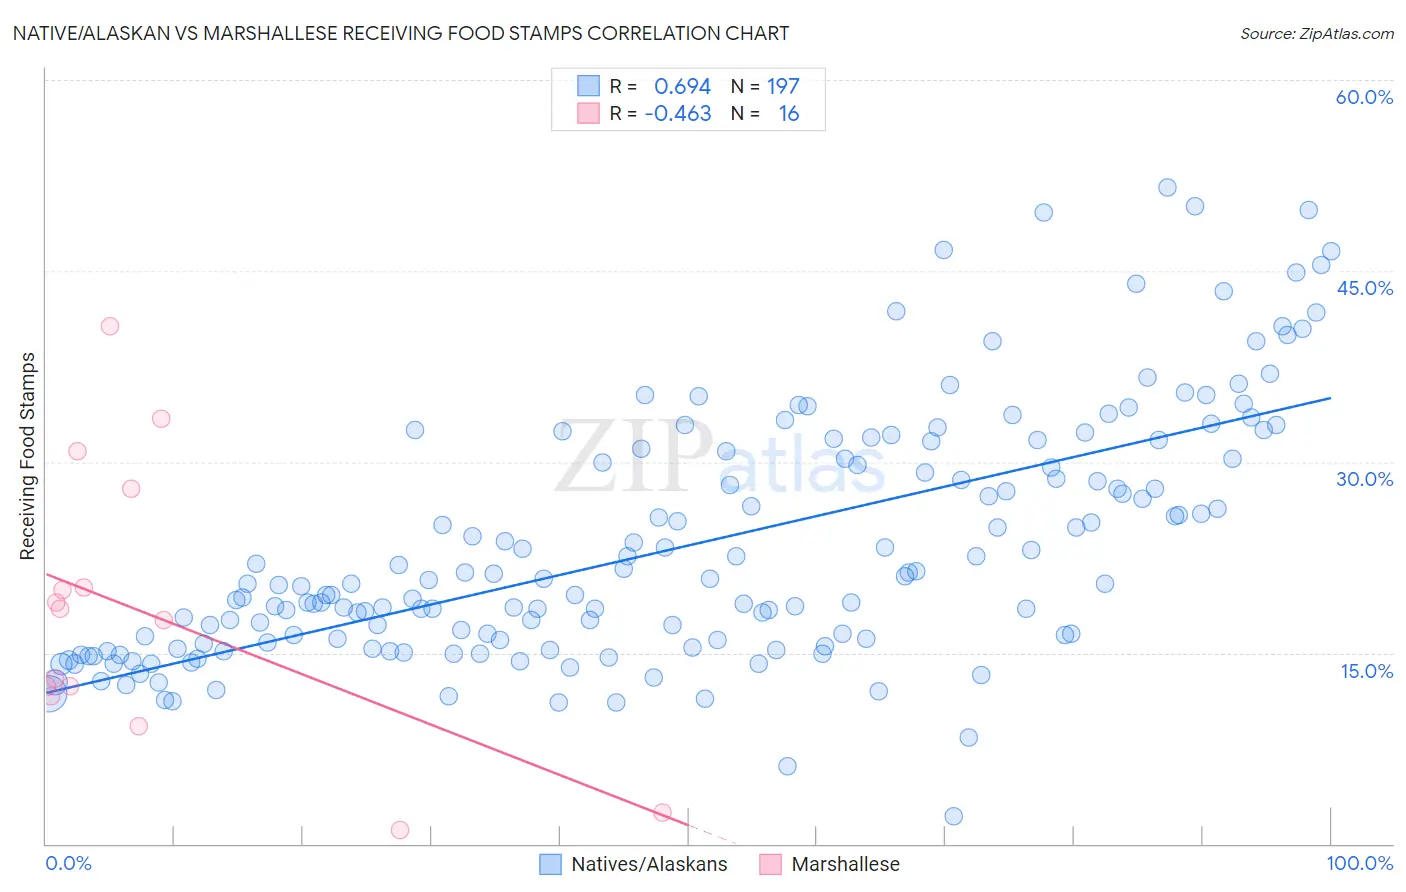
Native/Alaskan vs Marshallese Receiving Food Stamps Correlation Chart
The statistical analysis conducted on geographies consisting of 511,480,561 people shows a significant positive correlation between the proportion of Natives/Alaskans and percentage of population receiving government assistance and/or food stamps in the United States with a correlation coefficient (R) of 0.694 and weighted average of 17.3%. Similarly, the statistical analysis conducted on geographies consisting of 14,761,315 people shows a moderate negative correlation between the proportion of Marshallese and percentage of population receiving government assistance and/or food stamps in the United States with a correlation coefficient (R) of -0.463 and weighted average of 14.1%, a difference of 22.6%.
Receiving Food Stamps Correlation Summary
| Measurement | Native/Alaskan | Marshallese |
| Minimum | 2.2% | 1.1% |
| Maximum | 51.6% | 40.7% |
| Range | 49.4% | 39.6% |
| Mean | 23.4% | 18.1% |
| Median | 20.4% | 18.0% |
| Interquartile 25% (IQ1) | 15.8% | 12.0% |
| Interquartile 75% (IQ3) | 30.5% | 24.0% |
| Interquartile Range (IQR) | 14.7% | 12.0% |
| Standard Deviation (Sample) | 9.7% | 10.8% |
| Standard Deviation (Population) | 9.7% | 10.5% |
Similar Demographics by Receiving Food Stamps
Demographics Similar to Natives/Alaskans by Receiving Food Stamps
In terms of receiving food stamps, the demographic groups most similar to Natives/Alaskans are Immigrants from Nicaragua (17.2%, a difference of 0.18%), Immigrants from St. Vincent and the Grenadines (17.2%, a difference of 0.26%), Menominee (17.2%, a difference of 0.44%), Black/African American (17.2%, a difference of 0.62%), and Central American Indian (17.1%, a difference of 1.1%).
| Demographics | Rating | Rank | Receiving Food Stamps |
| Immigrants | Guyana | 0.0 /100 | #314 | Tragic 16.9% |
| Bahamians | 0.0 /100 | #315 | Tragic 17.0% |
| Central American Indians | 0.0 /100 | #316 | Tragic 17.1% |
| Blacks/African Americans | 0.0 /100 | #317 | Tragic 17.2% |
| Menominee | 0.0 /100 | #318 | Tragic 17.2% |
| Immigrants | St. Vincent and the Grenadines | 0.0 /100 | #319 | Tragic 17.2% |
| Immigrants | Nicaragua | 0.0 /100 | #320 | Tragic 17.2% |
| Natives/Alaskans | 0.0 /100 | #321 | Tragic 17.3% |
| Immigrants | Grenada | 0.0 /100 | #322 | Tragic 17.8% |
| Haitians | 0.0 /100 | #323 | Tragic 17.8% |
| British West Indians | 0.0 /100 | #324 | Tragic 17.9% |
| Immigrants | Haiti | 0.0 /100 | #325 | Tragic 18.2% |
| Cubans | 0.0 /100 | #326 | Tragic 18.2% |
| Apache | 0.0 /100 | #327 | Tragic 18.3% |
| Colville | 0.0 /100 | #328 | Tragic 18.3% |
Demographics Similar to Marshallese by Receiving Food Stamps
In terms of receiving food stamps, the demographic groups most similar to Marshallese are Subsaharan African (14.1%, a difference of 0.010%), Japanese (14.1%, a difference of 0.030%), Arapaho (14.1%, a difference of 0.14%), Immigrants from Ghana (14.1%, a difference of 0.21%), and Creek (14.1%, a difference of 0.34%).
| Demographics | Rating | Rank | Receiving Food Stamps |
| Mexican American Indians | 0.7 /100 | #247 | Tragic 13.8% |
| Immigrants | Laos | 0.7 /100 | #248 | Tragic 13.8% |
| Indonesians | 0.6 /100 | #249 | Tragic 13.9% |
| Immigrants | Cambodia | 0.5 /100 | #250 | Tragic 13.9% |
| Yaqui | 0.5 /100 | #251 | Tragic 13.9% |
| Ghanaians | 0.5 /100 | #252 | Tragic 14.0% |
| Spanish Americans | 0.4 /100 | #253 | Tragic 14.0% |
| Marshallese | 0.3 /100 | #254 | Tragic 14.1% |
| Sub-Saharan Africans | 0.3 /100 | #255 | Tragic 14.1% |
| Japanese | 0.3 /100 | #256 | Tragic 14.1% |
| Arapaho | 0.3 /100 | #257 | Tragic 14.1% |
| Immigrants | Ghana | 0.3 /100 | #258 | Tragic 14.1% |
| Creek | 0.3 /100 | #259 | Tragic 14.1% |
| Central Americans | 0.3 /100 | #260 | Tragic 14.1% |
| Immigrants | Congo | 0.3 /100 | #261 | Tragic 14.1% |