Native/Alaskan vs Cambodian 12th Grade, No Diploma
COMPARE
Native/Alaskan
Cambodian
12th Grade, No Diploma
12th Grade, No Diploma Comparison
Natives/Alaskans
Cambodians
87.7%
12TH GRADE, NO DIPLOMA
0.0/ 100
METRIC RATING
306th/ 347
METRIC RANK
92.6%
12TH GRADE, NO DIPLOMA
99.3/ 100
METRIC RATING
78th/ 347
METRIC RANK
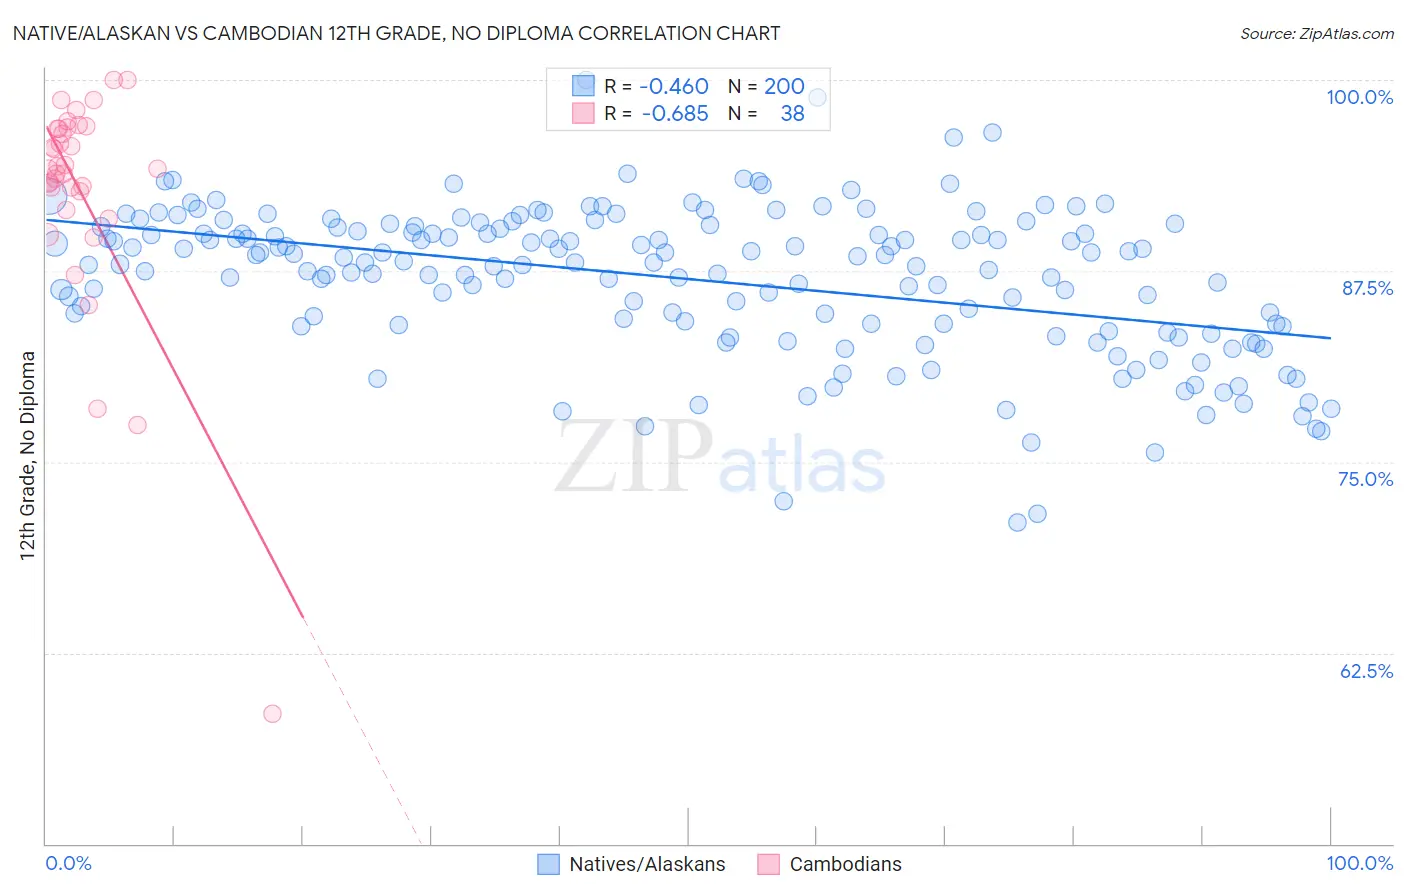
Native/Alaskan vs Cambodian 12th Grade, No Diploma Correlation Chart
The statistical analysis conducted on geographies consisting of 513,075,812 people shows a moderate negative correlation between the proportion of Natives/Alaskans and percentage of population with at least 12th grade (no diploma) education in the United States with a correlation coefficient (R) of -0.460 and weighted average of 87.7%. Similarly, the statistical analysis conducted on geographies consisting of 102,514,976 people shows a significant negative correlation between the proportion of Cambodians and percentage of population with at least 12th grade (no diploma) education in the United States with a correlation coefficient (R) of -0.685 and weighted average of 92.6%, a difference of 5.6%.
12th Grade, No Diploma Correlation Summary
| Measurement | Native/Alaskan | Cambodian |
| Minimum | 71.1% | 58.5% |
| Maximum | 100.0% | 100.0% |
| Range | 28.9% | 41.5% |
| Mean | 87.0% | 92.7% |
| Median | 88.1% | 94.2% |
| Interquartile 25% (IQ1) | 83.9% | 92.8% |
| Interquartile 75% (IQ3) | 90.3% | 96.8% |
| Interquartile Range (IQR) | 6.4% | 4.0% |
| Standard Deviation (Sample) | 4.9% | 7.5% |
| Standard Deviation (Population) | 4.9% | 7.4% |
Similar Demographics by 12th Grade, No Diploma
Demographics Similar to Natives/Alaskans by 12th Grade, No Diploma
In terms of 12th grade, no diploma, the demographic groups most similar to Natives/Alaskans are Immigrants from Portugal (87.6%, a difference of 0.040%), Immigrants from Dominica (87.7%, a difference of 0.070%), Yup'ik (87.6%, a difference of 0.080%), Immigrants from Armenia (87.6%, a difference of 0.11%), and Immigrants from Cuba (87.5%, a difference of 0.16%).
| Demographics | Rating | Rank | 12th Grade, No Diploma |
| Nepalese | 0.0 /100 | #299 | Tragic 88.1% |
| Immigrants | Guyana | 0.0 /100 | #300 | Tragic 88.1% |
| Immigrants | Cambodia | 0.0 /100 | #301 | Tragic 88.1% |
| Ecuadorians | 0.0 /100 | #302 | Tragic 88.0% |
| Immigrants | Bangladesh | 0.0 /100 | #303 | Tragic 88.0% |
| Vietnamese | 0.0 /100 | #304 | Tragic 87.9% |
| Immigrants | Dominica | 0.0 /100 | #305 | Tragic 87.7% |
| Natives/Alaskans | 0.0 /100 | #306 | Tragic 87.7% |
| Immigrants | Portugal | 0.0 /100 | #307 | Tragic 87.6% |
| Yup'ik | 0.0 /100 | #308 | Tragic 87.6% |
| Immigrants | Armenia | 0.0 /100 | #309 | Tragic 87.6% |
| Immigrants | Cuba | 0.0 /100 | #310 | Tragic 87.5% |
| Yaqui | 0.0 /100 | #311 | Tragic 87.5% |
| Immigrants | Ecuador | 0.0 /100 | #312 | Tragic 87.5% |
| Immigrants | Caribbean | 0.0 /100 | #313 | Tragic 87.4% |
Demographics Similar to Cambodians by 12th Grade, No Diploma
In terms of 12th grade, no diploma, the demographic groups most similar to Cambodians are Romanian (92.6%, a difference of 0.0%), French Canadian (92.6%, a difference of 0.020%), Immigrants from England (92.6%, a difference of 0.030%), Immigrants from Denmark (92.5%, a difference of 0.030%), and French (92.6%, a difference of 0.040%).
| Demographics | Rating | Rank | 12th Grade, No Diploma |
| Immigrants | Latvia | 99.5 /100 | #71 | Exceptional 92.6% |
| Immigrants | South Central Asia | 99.5 /100 | #72 | Exceptional 92.6% |
| Burmese | 99.4 /100 | #73 | Exceptional 92.6% |
| Immigrants | Moldova | 99.4 /100 | #74 | Exceptional 92.6% |
| Native Hawaiians | 99.4 /100 | #75 | Exceptional 92.6% |
| French | 99.4 /100 | #76 | Exceptional 92.6% |
| Immigrants | England | 99.4 /100 | #77 | Exceptional 92.6% |
| Cambodians | 99.3 /100 | #78 | Exceptional 92.6% |
| Romanians | 99.3 /100 | #79 | Exceptional 92.6% |
| French Canadians | 99.3 /100 | #80 | Exceptional 92.6% |
| Immigrants | Denmark | 99.2 /100 | #81 | Exceptional 92.5% |
| Immigrants | Switzerland | 99.2 /100 | #82 | Exceptional 92.5% |
| Immigrants | Israel | 99.2 /100 | #83 | Exceptional 92.5% |
| Immigrants | Bulgaria | 99.1 /100 | #84 | Exceptional 92.5% |
| Immigrants | Saudi Arabia | 99.0 /100 | #85 | Exceptional 92.5% |