Native/Alaskan vs Uruguayan 12th Grade, No Diploma
COMPARE
Native/Alaskan
Uruguayan
12th Grade, No Diploma
12th Grade, No Diploma Comparison
Natives/Alaskans
Uruguayans
87.7%
12TH GRADE, NO DIPLOMA
0.0/ 100
METRIC RATING
306th/ 347
METRIC RANK
90.4%
12TH GRADE, NO DIPLOMA
7.0/ 100
METRIC RATING
219th/ 347
METRIC RANK
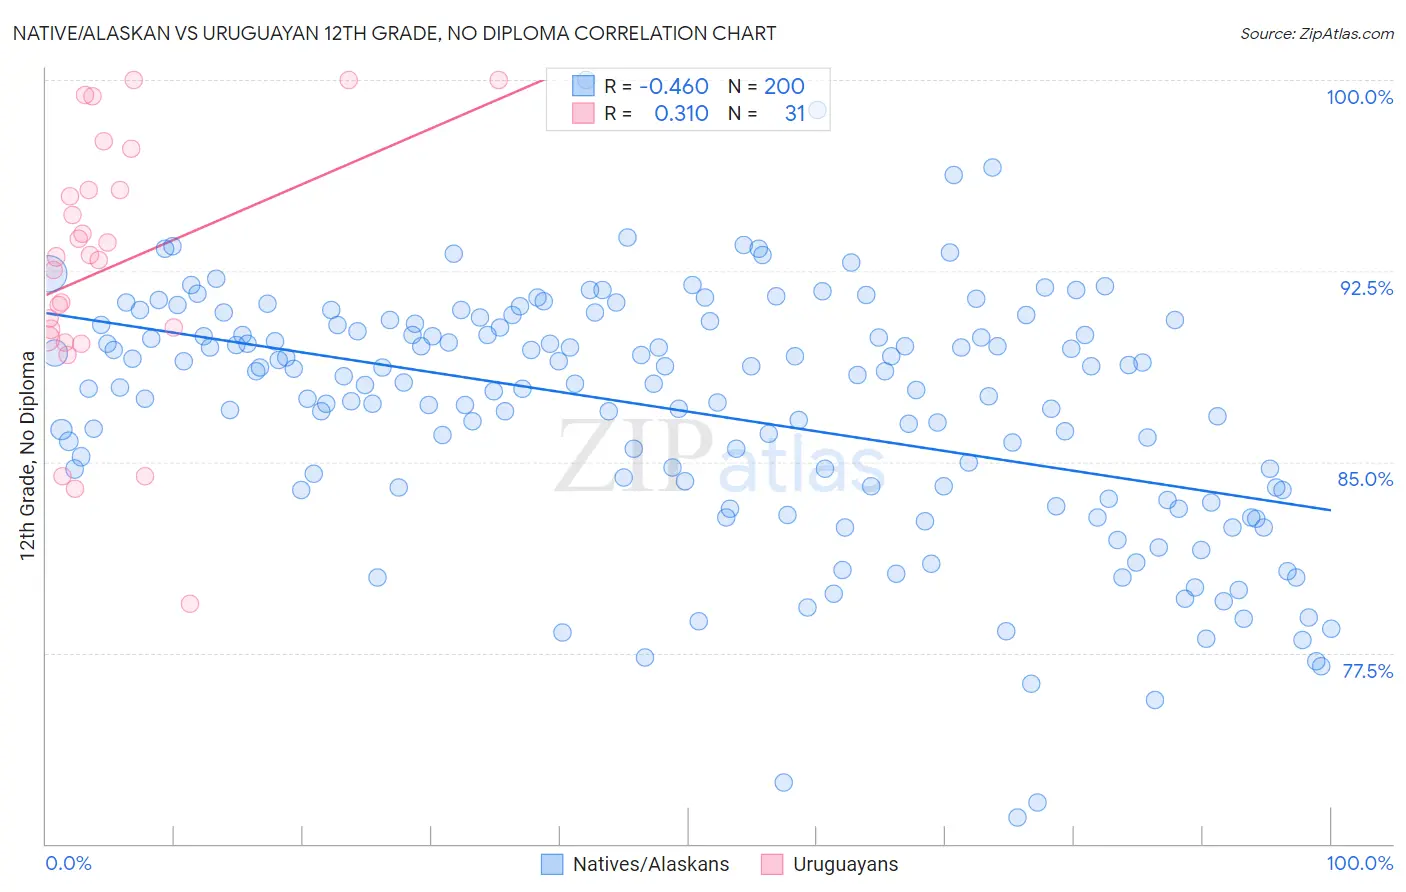
Native/Alaskan vs Uruguayan 12th Grade, No Diploma Correlation Chart
The statistical analysis conducted on geographies consisting of 513,075,812 people shows a moderate negative correlation between the proportion of Natives/Alaskans and percentage of population with at least 12th grade (no diploma) education in the United States with a correlation coefficient (R) of -0.460 and weighted average of 87.7%. Similarly, the statistical analysis conducted on geographies consisting of 144,782,615 people shows a mild positive correlation between the proportion of Uruguayans and percentage of population with at least 12th grade (no diploma) education in the United States with a correlation coefficient (R) of 0.310 and weighted average of 90.4%, a difference of 3.2%.
12th Grade, No Diploma Correlation Summary
| Measurement | Native/Alaskan | Uruguayan |
| Minimum | 71.1% | 79.4% |
| Maximum | 100.0% | 100.0% |
| Range | 28.9% | 20.6% |
| Mean | 87.0% | 92.7% |
| Median | 88.1% | 93.1% |
| Interquartile 25% (IQ1) | 83.9% | 89.9% |
| Interquartile 75% (IQ3) | 90.3% | 95.7% |
| Interquartile Range (IQR) | 6.4% | 5.8% |
| Standard Deviation (Sample) | 4.9% | 5.1% |
| Standard Deviation (Population) | 4.9% | 5.0% |
Similar Demographics by 12th Grade, No Diploma
Demographics Similar to Natives/Alaskans by 12th Grade, No Diploma
In terms of 12th grade, no diploma, the demographic groups most similar to Natives/Alaskans are Immigrants from Portugal (87.6%, a difference of 0.040%), Immigrants from Dominica (87.7%, a difference of 0.070%), Yup'ik (87.6%, a difference of 0.080%), Immigrants from Armenia (87.6%, a difference of 0.11%), and Immigrants from Cuba (87.5%, a difference of 0.16%).
| Demographics | Rating | Rank | 12th Grade, No Diploma |
| Nepalese | 0.0 /100 | #299 | Tragic 88.1% |
| Immigrants | Guyana | 0.0 /100 | #300 | Tragic 88.1% |
| Immigrants | Cambodia | 0.0 /100 | #301 | Tragic 88.1% |
| Ecuadorians | 0.0 /100 | #302 | Tragic 88.0% |
| Immigrants | Bangladesh | 0.0 /100 | #303 | Tragic 88.0% |
| Vietnamese | 0.0 /100 | #304 | Tragic 87.9% |
| Immigrants | Dominica | 0.0 /100 | #305 | Tragic 87.7% |
| Natives/Alaskans | 0.0 /100 | #306 | Tragic 87.7% |
| Immigrants | Portugal | 0.0 /100 | #307 | Tragic 87.6% |
| Yup'ik | 0.0 /100 | #308 | Tragic 87.6% |
| Immigrants | Armenia | 0.0 /100 | #309 | Tragic 87.6% |
| Immigrants | Cuba | 0.0 /100 | #310 | Tragic 87.5% |
| Yaqui | 0.0 /100 | #311 | Tragic 87.5% |
| Immigrants | Ecuador | 0.0 /100 | #312 | Tragic 87.5% |
| Immigrants | Caribbean | 0.0 /100 | #313 | Tragic 87.4% |
Demographics Similar to Uruguayans by 12th Grade, No Diploma
In terms of 12th grade, no diploma, the demographic groups most similar to Uruguayans are Shoshone (90.5%, a difference of 0.020%), Cherokee (90.5%, a difference of 0.020%), Immigrants from Cameroon (90.5%, a difference of 0.020%), Colombian (90.4%, a difference of 0.020%), and Arapaho (90.5%, a difference of 0.030%).
| Demographics | Rating | Rank | 12th Grade, No Diploma |
| Somalis | 10.2 /100 | #212 | Poor 90.6% |
| Costa Ricans | 9.4 /100 | #213 | Tragic 90.5% |
| Immigrants | Africa | 8.5 /100 | #214 | Tragic 90.5% |
| Arapaho | 7.7 /100 | #215 | Tragic 90.5% |
| Shoshone | 7.5 /100 | #216 | Tragic 90.5% |
| Cherokee | 7.4 /100 | #217 | Tragic 90.5% |
| Immigrants | Cameroon | 7.4 /100 | #218 | Tragic 90.5% |
| Uruguayans | 7.0 /100 | #219 | Tragic 90.4% |
| Colombians | 6.6 /100 | #220 | Tragic 90.4% |
| Immigrants | Liberia | 5.7 /100 | #221 | Tragic 90.4% |
| Immigrants | Somalia | 5.3 /100 | #222 | Tragic 90.4% |
| South Americans | 5.0 /100 | #223 | Tragic 90.3% |
| Immigrants | Panama | 4.8 /100 | #224 | Tragic 90.3% |
| Chickasaw | 4.8 /100 | #225 | Tragic 90.3% |
| Immigrants | Zaire | 4.6 /100 | #226 | Tragic 90.3% |