Native Hawaiian vs Native/Alaskan 6th Grade
COMPARE
Native Hawaiian
Native/Alaskan
6th Grade
6th Grade Comparison
Native Hawaiians
Natives/Alaskans
97.8%
6TH GRADE
99.9/ 100
METRIC RATING
47th/ 347
METRIC RANK
96.8%
6TH GRADE
13.0/ 100
METRIC RATING
205th/ 347
METRIC RANK
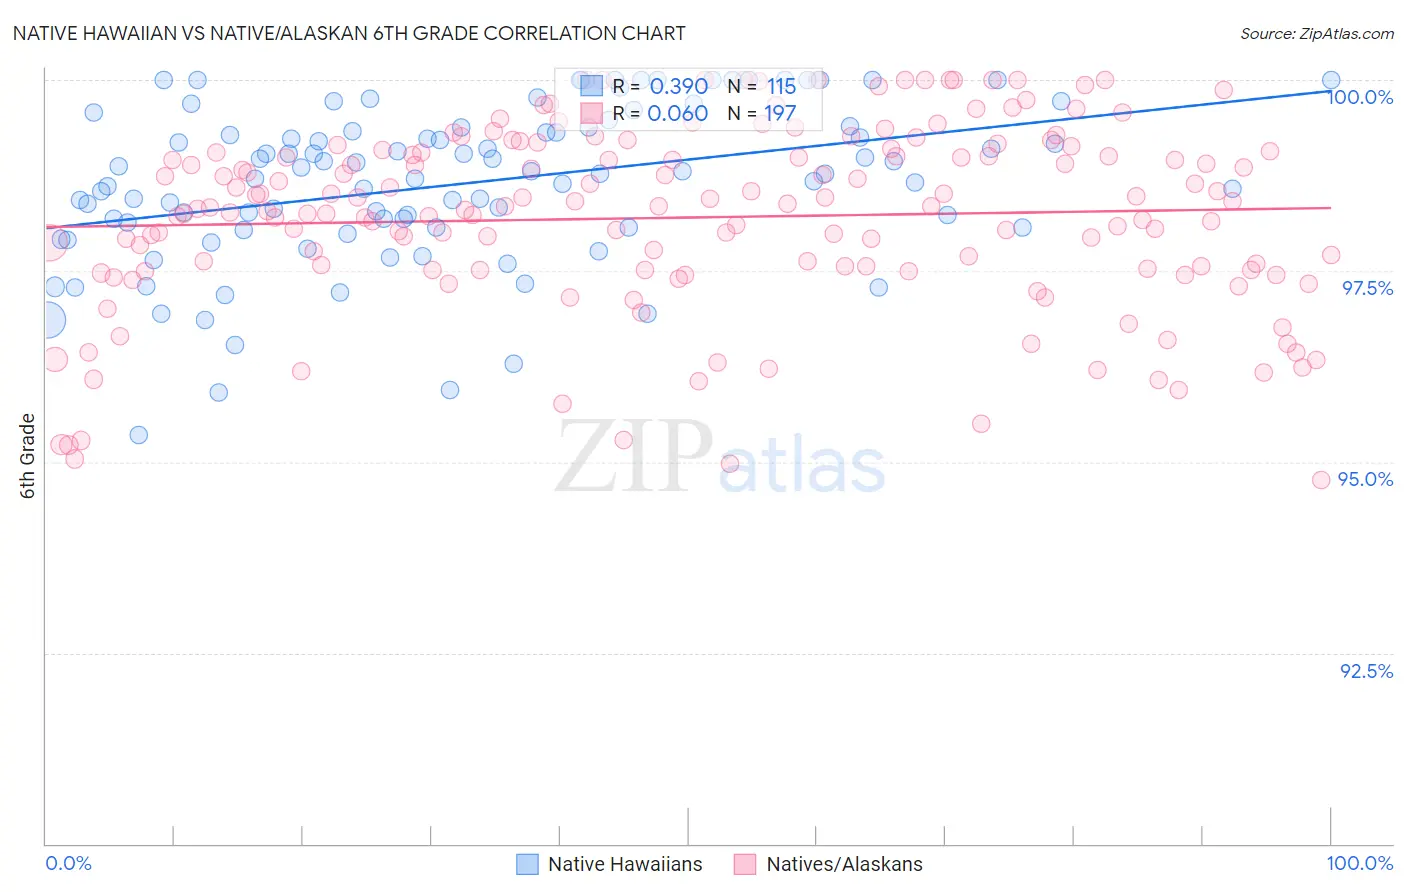
Native Hawaiian vs Native/Alaskan 6th Grade Correlation Chart
The statistical analysis conducted on geographies consisting of 332,114,258 people shows a mild positive correlation between the proportion of Native Hawaiians and percentage of population with at least 6th grade education in the United States with a correlation coefficient (R) of 0.390 and weighted average of 97.8%. Similarly, the statistical analysis conducted on geographies consisting of 513,056,654 people shows a slight positive correlation between the proportion of Natives/Alaskans and percentage of population with at least 6th grade education in the United States with a correlation coefficient (R) of 0.060 and weighted average of 96.8%, a difference of 0.97%.
6th Grade Correlation Summary
| Measurement | Native Hawaiian | Native/Alaskan |
| Minimum | 95.3% | 94.8% |
| Maximum | 100.0% | 100.0% |
| Range | 4.7% | 5.2% |
| Mean | 98.6% | 98.2% |
| Median | 98.8% | 98.3% |
| Interquartile 25% (IQ1) | 98.1% | 97.5% |
| Interquartile 75% (IQ3) | 99.4% | 99.1% |
| Interquartile Range (IQR) | 1.3% | 1.6% |
| Standard Deviation (Sample) | 1.0% | 1.2% |
| Standard Deviation (Population) | 1.0% | 1.2% |
Similar Demographics by 6th Grade
Demographics Similar to Native Hawaiians by 6th Grade
In terms of 6th grade, the demographic groups most similar to Native Hawaiians are Celtic (97.8%, a difference of 0.0%), Estonian (97.8%, a difference of 0.0%), Immigrants from Scotland (97.8%, a difference of 0.0%), Arapaho (97.8%, a difference of 0.010%), and Maltese (97.8%, a difference of 0.010%).
| Demographics | Rating | Rank | 6th Grade |
| Latvians | 99.9 /100 | #40 | Exceptional 97.9% |
| Eastern Europeans | 99.9 /100 | #41 | Exceptional 97.9% |
| Hungarians | 99.9 /100 | #42 | Exceptional 97.8% |
| Northern Europeans | 99.9 /100 | #43 | Exceptional 97.8% |
| Czechoslovakians | 99.9 /100 | #44 | Exceptional 97.8% |
| Bulgarians | 99.9 /100 | #45 | Exceptional 97.8% |
| Arapaho | 99.9 /100 | #46 | Exceptional 97.8% |
| Native Hawaiians | 99.9 /100 | #47 | Exceptional 97.8% |
| Celtics | 99.9 /100 | #48 | Exceptional 97.8% |
| Estonians | 99.8 /100 | #49 | Exceptional 97.8% |
| Immigrants | Scotland | 99.8 /100 | #50 | Exceptional 97.8% |
| Maltese | 99.8 /100 | #51 | Exceptional 97.8% |
| Australians | 99.8 /100 | #52 | Exceptional 97.8% |
| Slavs | 99.8 /100 | #53 | Exceptional 97.8% |
| Creek | 99.8 /100 | #54 | Exceptional 97.7% |
Demographics Similar to Natives/Alaskans by 6th Grade
In terms of 6th grade, the demographic groups most similar to Natives/Alaskans are Immigrants from Zaire (96.9%, a difference of 0.010%), Immigrants from Chile (96.8%, a difference of 0.010%), Sudanese (96.8%, a difference of 0.010%), Immigrants from Bahamas (96.8%, a difference of 0.010%), and Laotian (96.8%, a difference of 0.010%).
| Demographics | Rating | Rank | 6th Grade |
| Immigrants | Albania | 18.8 /100 | #198 | Poor 96.9% |
| Immigrants | Northern Africa | 15.7 /100 | #199 | Poor 96.9% |
| Africans | 14.8 /100 | #200 | Poor 96.9% |
| Immigrants | Zaire | 14.5 /100 | #201 | Poor 96.9% |
| Immigrants | Chile | 14.2 /100 | #202 | Poor 96.8% |
| Sudanese | 13.9 /100 | #203 | Poor 96.8% |
| Immigrants | Bahamas | 13.8 /100 | #204 | Poor 96.8% |
| Natives/Alaskans | 13.0 /100 | #205 | Poor 96.8% |
| Laotians | 11.8 /100 | #206 | Poor 96.8% |
| Iraqis | 11.7 /100 | #207 | Poor 96.8% |
| Samoans | 11.0 /100 | #208 | Poor 96.8% |
| Immigrants | Oceania | 11.0 /100 | #209 | Poor 96.8% |
| Immigrants | Nepal | 10.1 /100 | #210 | Poor 96.8% |
| Immigrants | Iraq | 9.2 /100 | #211 | Tragic 96.8% |
| Moroccans | 9.0 /100 | #212 | Tragic 96.8% |