Native Hawaiian vs Indian (Asian) 6th Grade
COMPARE
Native Hawaiian
Indian (Asian)
6th Grade
6th Grade Comparison
Native Hawaiians
Indians (Asian)
97.8%
6TH GRADE
99.9/ 100
METRIC RATING
47th/ 347
METRIC RANK
96.6%
6TH GRADE
1.9/ 100
METRIC RATING
239th/ 347
METRIC RANK
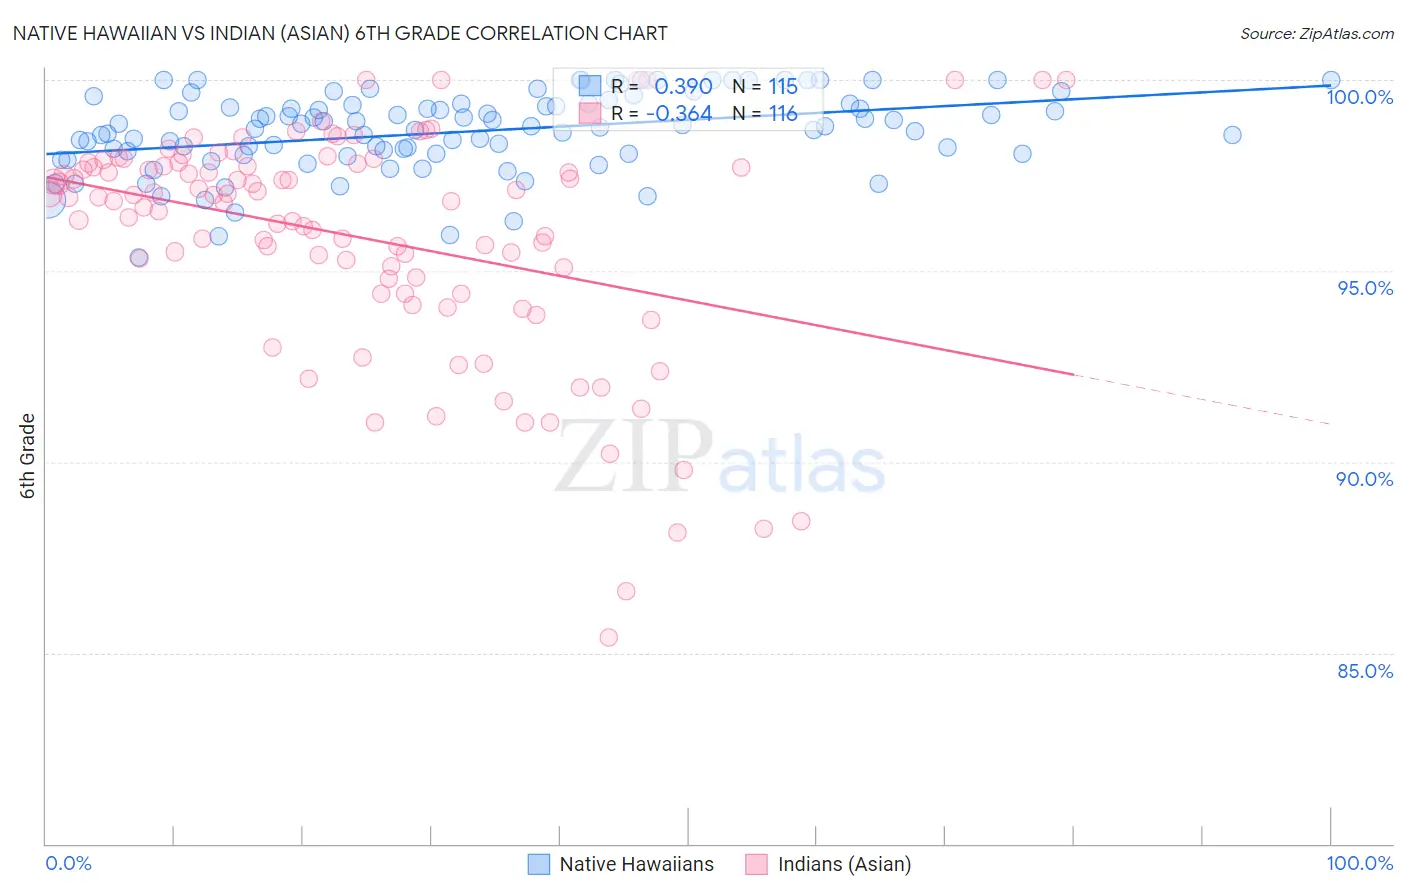
Native Hawaiian vs Indian (Asian) 6th Grade Correlation Chart
The statistical analysis conducted on geographies consisting of 332,114,258 people shows a mild positive correlation between the proportion of Native Hawaiians and percentage of population with at least 6th grade education in the United States with a correlation coefficient (R) of 0.390 and weighted average of 97.8%. Similarly, the statistical analysis conducted on geographies consisting of 495,287,818 people shows a mild negative correlation between the proportion of Indians (Asian) and percentage of population with at least 6th grade education in the United States with a correlation coefficient (R) of -0.364 and weighted average of 96.6%, a difference of 1.2%.
6th Grade Correlation Summary
| Measurement | Native Hawaiian | Indian (Asian) |
| Minimum | 95.3% | 85.4% |
| Maximum | 100.0% | 100.0% |
| Range | 4.7% | 14.6% |
| Mean | 98.6% | 95.9% |
| Median | 98.8% | 96.9% |
| Interquartile 25% (IQ1) | 98.1% | 94.6% |
| Interquartile 75% (IQ3) | 99.4% | 97.8% |
| Interquartile Range (IQR) | 1.3% | 3.2% |
| Standard Deviation (Sample) | 1.0% | 3.0% |
| Standard Deviation (Population) | 1.0% | 3.0% |
Similar Demographics by 6th Grade
Demographics Similar to Native Hawaiians by 6th Grade
In terms of 6th grade, the demographic groups most similar to Native Hawaiians are Celtic (97.8%, a difference of 0.0%), Estonian (97.8%, a difference of 0.0%), Immigrants from Scotland (97.8%, a difference of 0.0%), Arapaho (97.8%, a difference of 0.010%), and Maltese (97.8%, a difference of 0.010%).
| Demographics | Rating | Rank | 6th Grade |
| Latvians | 99.9 /100 | #40 | Exceptional 97.9% |
| Eastern Europeans | 99.9 /100 | #41 | Exceptional 97.9% |
| Hungarians | 99.9 /100 | #42 | Exceptional 97.8% |
| Northern Europeans | 99.9 /100 | #43 | Exceptional 97.8% |
| Czechoslovakians | 99.9 /100 | #44 | Exceptional 97.8% |
| Bulgarians | 99.9 /100 | #45 | Exceptional 97.8% |
| Arapaho | 99.9 /100 | #46 | Exceptional 97.8% |
| Native Hawaiians | 99.9 /100 | #47 | Exceptional 97.8% |
| Celtics | 99.9 /100 | #48 | Exceptional 97.8% |
| Estonians | 99.8 /100 | #49 | Exceptional 97.8% |
| Immigrants | Scotland | 99.8 /100 | #50 | Exceptional 97.8% |
| Maltese | 99.8 /100 | #51 | Exceptional 97.8% |
| Australians | 99.8 /100 | #52 | Exceptional 97.8% |
| Slavs | 99.8 /100 | #53 | Exceptional 97.8% |
| Creek | 99.8 /100 | #54 | Exceptional 97.7% |
Demographics Similar to Indians (Asian) by 6th Grade
In terms of 6th grade, the demographic groups most similar to Indians (Asian) are Nigerian (96.6%, a difference of 0.0%), Korean (96.6%, a difference of 0.0%), Senegalese (96.6%, a difference of 0.0%), Immigrants from Eastern Africa (96.6%, a difference of 0.010%), and Immigrants from Asia (96.6%, a difference of 0.010%).
| Demographics | Rating | Rank | 6th Grade |
| South American Indians | 3.5 /100 | #232 | Tragic 96.7% |
| Yuman | 3.2 /100 | #233 | Tragic 96.7% |
| Uruguayans | 2.5 /100 | #234 | Tragic 96.6% |
| Asians | 2.4 /100 | #235 | Tragic 96.6% |
| Immigrants | Indonesia | 2.3 /100 | #236 | Tragic 96.6% |
| Immigrants | Eastern Africa | 2.0 /100 | #237 | Tragic 96.6% |
| Nigerians | 1.9 /100 | #238 | Tragic 96.6% |
| Indians (Asian) | 1.9 /100 | #239 | Tragic 96.6% |
| Koreans | 1.9 /100 | #240 | Tragic 96.6% |
| Senegalese | 1.8 /100 | #241 | Tragic 96.6% |
| Immigrants | Asia | 1.8 /100 | #242 | Tragic 96.6% |
| Immigrants | Liberia | 1.6 /100 | #243 | Tragic 96.6% |
| Ethiopians | 1.5 /100 | #244 | Tragic 96.6% |
| Immigrants | Costa Rica | 1.3 /100 | #245 | Tragic 96.6% |
| Immigrants | Africa | 1.3 /100 | #246 | Tragic 96.6% |