Native Hawaiian vs Immigrants from Barbados 6th Grade
COMPARE
Native Hawaiian
Immigrants from Barbados
6th Grade
6th Grade Comparison
Native Hawaiians
Immigrants from Barbados
97.8%
6TH GRADE
99.9/ 100
METRIC RATING
47th/ 347
METRIC RANK
96.1%
6TH GRADE
0.0/ 100
METRIC RATING
292nd/ 347
METRIC RANK
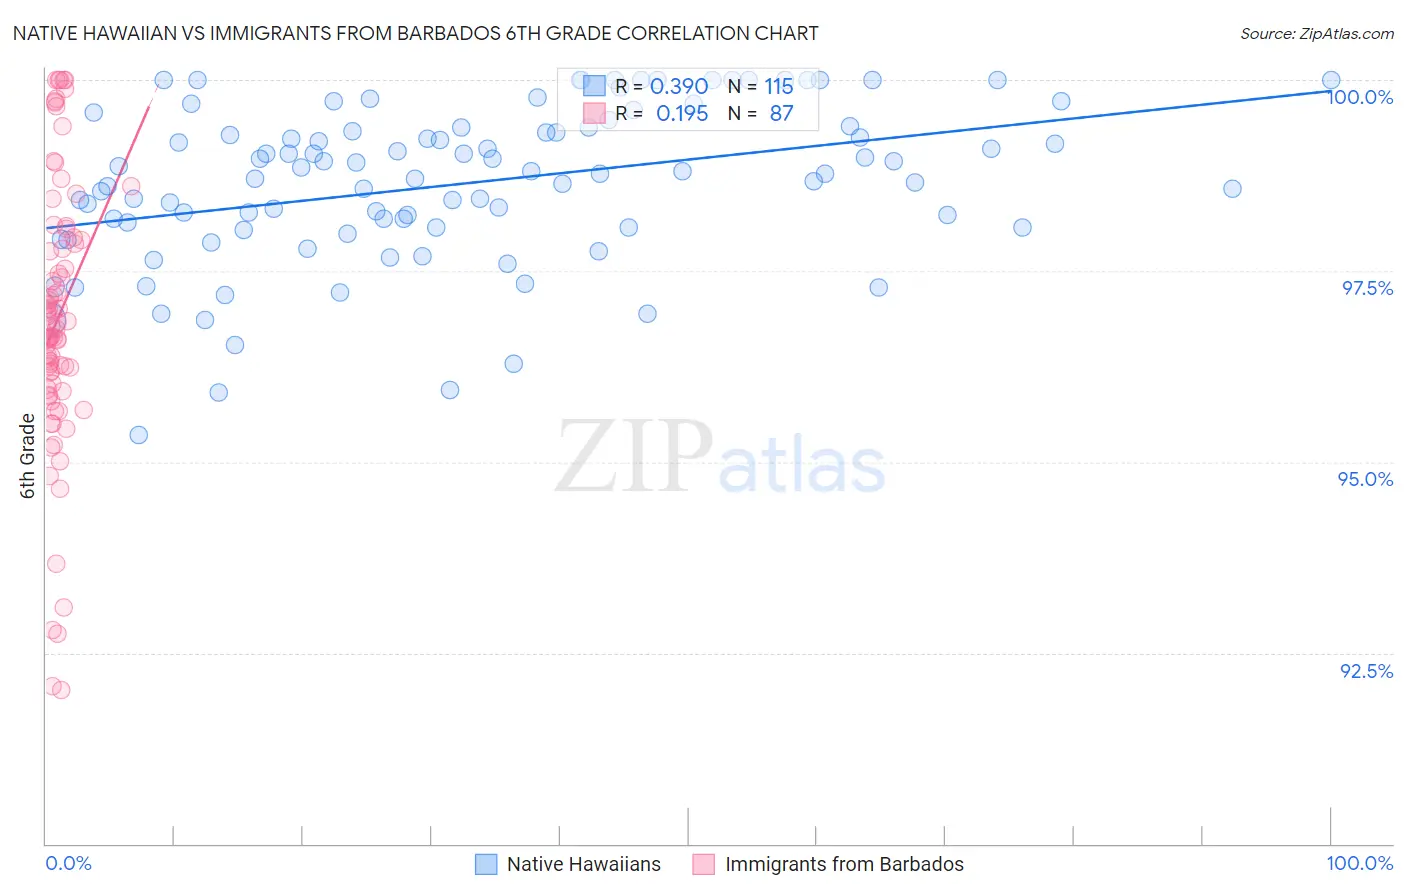
Native Hawaiian vs Immigrants from Barbados 6th Grade Correlation Chart
The statistical analysis conducted on geographies consisting of 332,114,258 people shows a mild positive correlation between the proportion of Native Hawaiians and percentage of population with at least 6th grade education in the United States with a correlation coefficient (R) of 0.390 and weighted average of 97.8%. Similarly, the statistical analysis conducted on geographies consisting of 112,788,359 people shows a poor positive correlation between the proportion of Immigrants from Barbados and percentage of population with at least 6th grade education in the United States with a correlation coefficient (R) of 0.195 and weighted average of 96.1%, a difference of 1.7%.
6th Grade Correlation Summary
| Measurement | Native Hawaiian | Immigrants from Barbados |
| Minimum | 95.3% | 92.0% |
| Maximum | 100.0% | 100.0% |
| Range | 4.7% | 8.0% |
| Mean | 98.6% | 96.9% |
| Median | 98.8% | 96.7% |
| Interquartile 25% (IQ1) | 98.1% | 96.0% |
| Interquartile 75% (IQ3) | 99.4% | 97.9% |
| Interquartile Range (IQR) | 1.3% | 2.0% |
| Standard Deviation (Sample) | 1.0% | 1.8% |
| Standard Deviation (Population) | 1.0% | 1.8% |
Similar Demographics by 6th Grade
Demographics Similar to Native Hawaiians by 6th Grade
In terms of 6th grade, the demographic groups most similar to Native Hawaiians are Celtic (97.8%, a difference of 0.0%), Estonian (97.8%, a difference of 0.0%), Immigrants from Scotland (97.8%, a difference of 0.0%), Arapaho (97.8%, a difference of 0.010%), and Maltese (97.8%, a difference of 0.010%).
| Demographics | Rating | Rank | 6th Grade |
| Latvians | 99.9 /100 | #40 | Exceptional 97.9% |
| Eastern Europeans | 99.9 /100 | #41 | Exceptional 97.9% |
| Hungarians | 99.9 /100 | #42 | Exceptional 97.8% |
| Northern Europeans | 99.9 /100 | #43 | Exceptional 97.8% |
| Czechoslovakians | 99.9 /100 | #44 | Exceptional 97.8% |
| Bulgarians | 99.9 /100 | #45 | Exceptional 97.8% |
| Arapaho | 99.9 /100 | #46 | Exceptional 97.8% |
| Native Hawaiians | 99.9 /100 | #47 | Exceptional 97.8% |
| Celtics | 99.9 /100 | #48 | Exceptional 97.8% |
| Estonians | 99.8 /100 | #49 | Exceptional 97.8% |
| Immigrants | Scotland | 99.8 /100 | #50 | Exceptional 97.8% |
| Maltese | 99.8 /100 | #51 | Exceptional 97.8% |
| Australians | 99.8 /100 | #52 | Exceptional 97.8% |
| Slavs | 99.8 /100 | #53 | Exceptional 97.8% |
| Creek | 99.8 /100 | #54 | Exceptional 97.7% |
Demographics Similar to Immigrants from Barbados by 6th Grade
In terms of 6th grade, the demographic groups most similar to Immigrants from Barbados are Immigrants from Somalia (96.1%, a difference of 0.020%), Immigrants from St. Vincent and the Grenadines (96.1%, a difference of 0.020%), Immigrants from Eritrea (96.1%, a difference of 0.040%), Immigrants from West Indies (96.1%, a difference of 0.040%), and Malaysian (96.2%, a difference of 0.060%).
| Demographics | Rating | Rank | 6th Grade |
| Somalis | 0.1 /100 | #285 | Tragic 96.2% |
| Barbadians | 0.0 /100 | #286 | Tragic 96.2% |
| Immigrants | Trinidad and Tobago | 0.0 /100 | #287 | Tragic 96.2% |
| Malaysians | 0.0 /100 | #288 | Tragic 96.2% |
| Immigrants | Eritrea | 0.0 /100 | #289 | Tragic 96.1% |
| Immigrants | Somalia | 0.0 /100 | #290 | Tragic 96.1% |
| Immigrants | St. Vincent and the Grenadines | 0.0 /100 | #291 | Tragic 96.1% |
| Immigrants | Barbados | 0.0 /100 | #292 | Tragic 96.1% |
| Immigrants | West Indies | 0.0 /100 | #293 | Tragic 96.1% |
| British West Indians | 0.0 /100 | #294 | Tragic 96.0% |
| Immigrants | Grenada | 0.0 /100 | #295 | Tragic 95.9% |
| Immigrants | South Eastern Asia | 0.0 /100 | #296 | Tragic 95.9% |
| Haitians | 0.0 /100 | #297 | Tragic 95.8% |
| Sri Lankans | 0.0 /100 | #298 | Tragic 95.8% |
| Immigrants | Laos | 0.0 /100 | #299 | Tragic 95.7% |