Korean vs Native/Alaskan 6th Grade
COMPARE
Korean
Native/Alaskan
6th Grade
6th Grade Comparison
Koreans
Natives/Alaskans
96.6%
6TH GRADE
1.9/ 100
METRIC RATING
240th/ 347
METRIC RANK
96.8%
6TH GRADE
13.0/ 100
METRIC RATING
205th/ 347
METRIC RANK
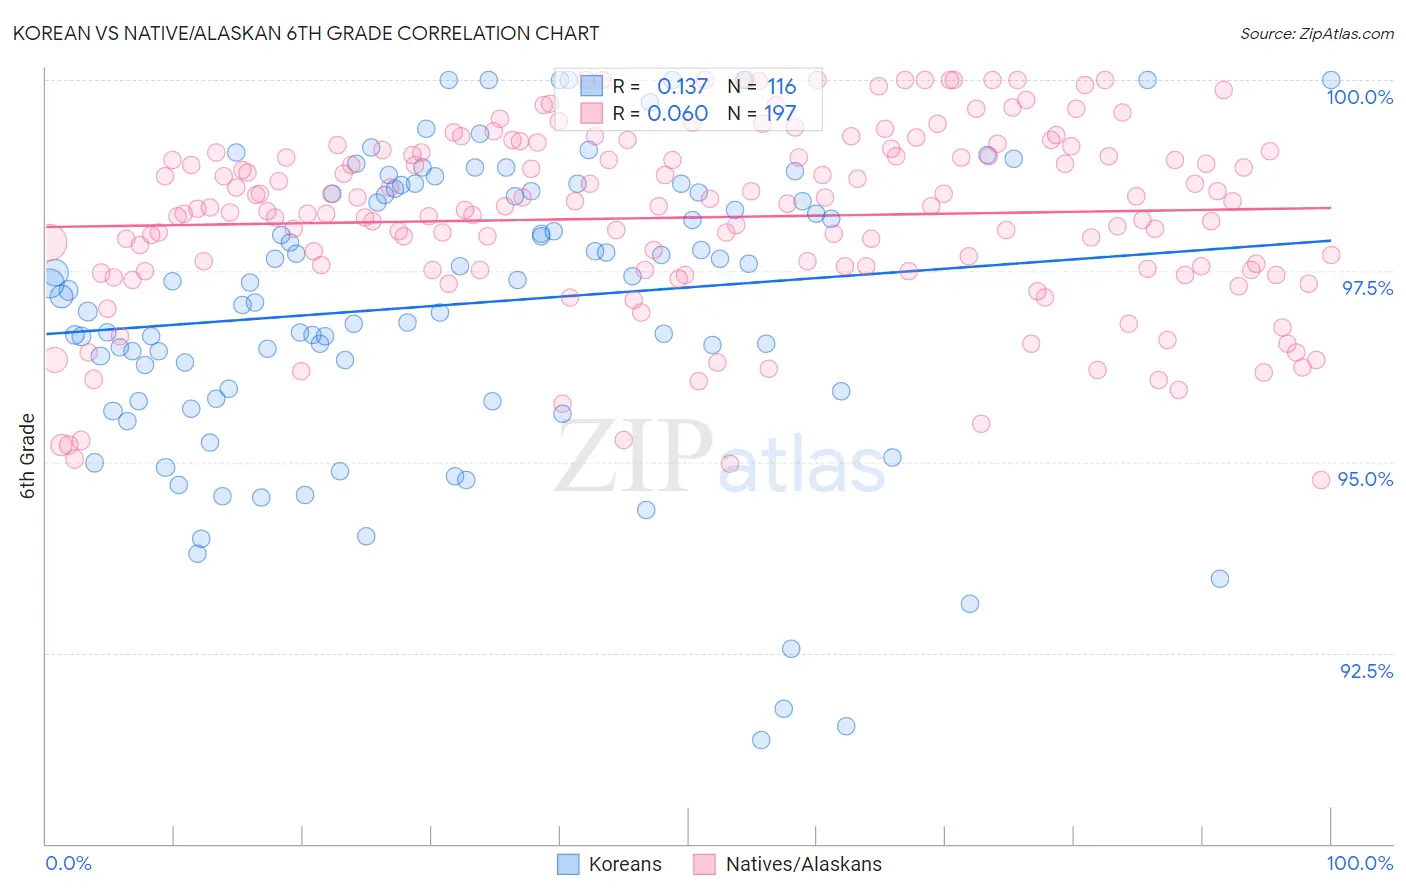
Korean vs Native/Alaskan 6th Grade Correlation Chart
The statistical analysis conducted on geographies consisting of 510,946,939 people shows a poor positive correlation between the proportion of Koreans and percentage of population with at least 6th grade education in the United States with a correlation coefficient (R) of 0.137 and weighted average of 96.6%. Similarly, the statistical analysis conducted on geographies consisting of 513,056,654 people shows a slight positive correlation between the proportion of Natives/Alaskans and percentage of population with at least 6th grade education in the United States with a correlation coefficient (R) of 0.060 and weighted average of 96.8%, a difference of 0.24%.
6th Grade Correlation Summary
| Measurement | Korean | Native/Alaskan |
| Minimum | 91.4% | 94.8% |
| Maximum | 100.0% | 100.0% |
| Range | 8.6% | 5.2% |
| Mean | 97.1% | 98.2% |
| Median | 97.3% | 98.3% |
| Interquartile 25% (IQ1) | 95.9% | 97.5% |
| Interquartile 75% (IQ3) | 98.5% | 99.1% |
| Interquartile Range (IQR) | 2.6% | 1.6% |
| Standard Deviation (Sample) | 1.9% | 1.2% |
| Standard Deviation (Population) | 1.9% | 1.2% |
Similar Demographics by 6th Grade
Demographics Similar to Koreans by 6th Grade
In terms of 6th grade, the demographic groups most similar to Koreans are Nigerian (96.6%, a difference of 0.0%), Indian (Asian) (96.6%, a difference of 0.0%), Senegalese (96.6%, a difference of 0.0%), Immigrants from Eastern Africa (96.6%, a difference of 0.010%), and Immigrants from Asia (96.6%, a difference of 0.010%).
| Demographics | Rating | Rank | 6th Grade |
| Yuman | 3.2 /100 | #233 | Tragic 96.7% |
| Uruguayans | 2.5 /100 | #234 | Tragic 96.6% |
| Asians | 2.4 /100 | #235 | Tragic 96.6% |
| Immigrants | Indonesia | 2.3 /100 | #236 | Tragic 96.6% |
| Immigrants | Eastern Africa | 2.0 /100 | #237 | Tragic 96.6% |
| Nigerians | 1.9 /100 | #238 | Tragic 96.6% |
| Indians (Asian) | 1.9 /100 | #239 | Tragic 96.6% |
| Koreans | 1.9 /100 | #240 | Tragic 96.6% |
| Senegalese | 1.8 /100 | #241 | Tragic 96.6% |
| Immigrants | Asia | 1.8 /100 | #242 | Tragic 96.6% |
| Immigrants | Liberia | 1.6 /100 | #243 | Tragic 96.6% |
| Ethiopians | 1.5 /100 | #244 | Tragic 96.6% |
| Immigrants | Costa Rica | 1.3 /100 | #245 | Tragic 96.6% |
| Immigrants | Africa | 1.3 /100 | #246 | Tragic 96.6% |
| Bolivians | 1.0 /100 | #247 | Tragic 96.5% |
Demographics Similar to Natives/Alaskans by 6th Grade
In terms of 6th grade, the demographic groups most similar to Natives/Alaskans are Immigrants from Zaire (96.9%, a difference of 0.010%), Immigrants from Chile (96.8%, a difference of 0.010%), Sudanese (96.8%, a difference of 0.010%), Immigrants from Bahamas (96.8%, a difference of 0.010%), and Laotian (96.8%, a difference of 0.010%).
| Demographics | Rating | Rank | 6th Grade |
| Immigrants | Albania | 18.8 /100 | #198 | Poor 96.9% |
| Immigrants | Northern Africa | 15.7 /100 | #199 | Poor 96.9% |
| Africans | 14.8 /100 | #200 | Poor 96.9% |
| Immigrants | Zaire | 14.5 /100 | #201 | Poor 96.9% |
| Immigrants | Chile | 14.2 /100 | #202 | Poor 96.8% |
| Sudanese | 13.9 /100 | #203 | Poor 96.8% |
| Immigrants | Bahamas | 13.8 /100 | #204 | Poor 96.8% |
| Natives/Alaskans | 13.0 /100 | #205 | Poor 96.8% |
| Laotians | 11.8 /100 | #206 | Poor 96.8% |
| Iraqis | 11.7 /100 | #207 | Poor 96.8% |
| Samoans | 11.0 /100 | #208 | Poor 96.8% |
| Immigrants | Oceania | 11.0 /100 | #209 | Poor 96.8% |
| Immigrants | Nepal | 10.1 /100 | #210 | Poor 96.8% |
| Immigrants | Iraq | 9.2 /100 | #211 | Tragic 96.8% |
| Moroccans | 9.0 /100 | #212 | Tragic 96.8% |