Immigrants from Brazil vs Native/Alaskan 6th Grade
COMPARE
Immigrants from Brazil
Native/Alaskan
6th Grade
6th Grade Comparison
Immigrants from Brazil
Natives/Alaskans
96.9%
6TH GRADE
25.5/ 100
METRIC RATING
195th/ 347
METRIC RANK
96.8%
6TH GRADE
13.0/ 100
METRIC RATING
205th/ 347
METRIC RANK
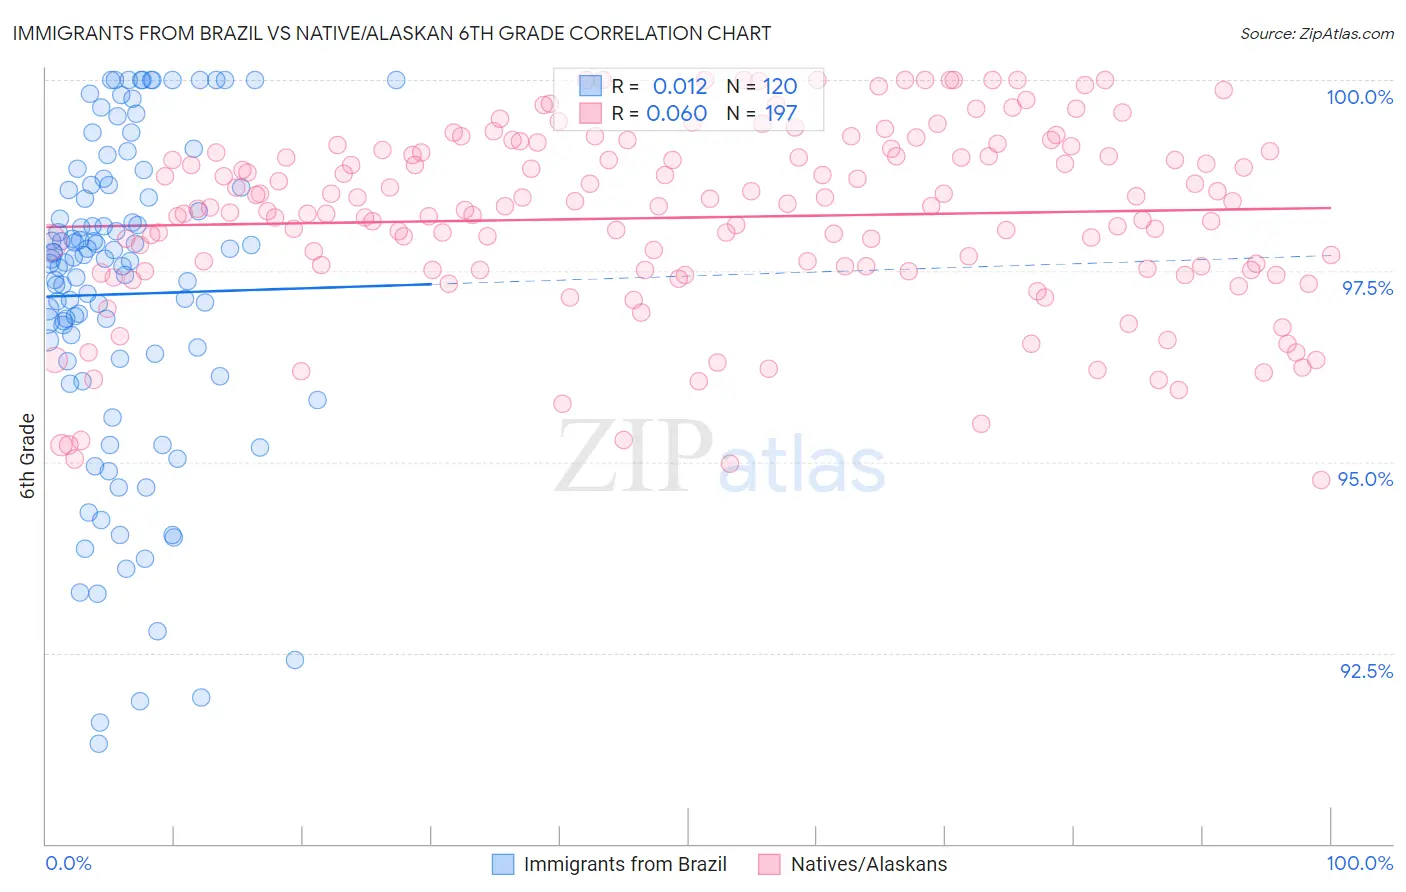
Immigrants from Brazil vs Native/Alaskan 6th Grade Correlation Chart
The statistical analysis conducted on geographies consisting of 343,021,580 people shows no correlation between the proportion of Immigrants from Brazil and percentage of population with at least 6th grade education in the United States with a correlation coefficient (R) of 0.012 and weighted average of 96.9%. Similarly, the statistical analysis conducted on geographies consisting of 513,056,654 people shows a slight positive correlation between the proportion of Natives/Alaskans and percentage of population with at least 6th grade education in the United States with a correlation coefficient (R) of 0.060 and weighted average of 96.8%, a difference of 0.090%.
6th Grade Correlation Summary
| Measurement | Immigrants from Brazil | Native/Alaskan |
| Minimum | 91.3% | 94.8% |
| Maximum | 100.0% | 100.0% |
| Range | 8.7% | 5.2% |
| Mean | 97.2% | 98.2% |
| Median | 97.6% | 98.3% |
| Interquartile 25% (IQ1) | 96.3% | 97.5% |
| Interquartile 75% (IQ3) | 98.6% | 99.1% |
| Interquartile Range (IQR) | 2.2% | 1.6% |
| Standard Deviation (Sample) | 2.1% | 1.2% |
| Standard Deviation (Population) | 2.1% | 1.2% |
Demographics Similar to Immigrants from Brazil and Natives/Alaskans by 6th Grade
In terms of 6th grade, the demographic groups most similar to Immigrants from Brazil are Immigrants from Lebanon (96.9%, a difference of 0.0%), Panamanian (96.9%, a difference of 0.010%), Hawaiian (96.9%, a difference of 0.010%), Paraguayan (96.9%, a difference of 0.010%), and Dutch West Indian (96.9%, a difference of 0.020%). Similarly, the demographic groups most similar to Natives/Alaskans are Immigrants from Zaire (96.9%, a difference of 0.010%), Immigrants from Chile (96.8%, a difference of 0.010%), Sudanese (96.8%, a difference of 0.010%), Immigrants from Bahamas (96.8%, a difference of 0.010%), and Laotian (96.8%, a difference of 0.010%).
| Demographics | Rating | Rank | 6th Grade |
| Dutch West Indians | 28.3 /100 | #190 | Fair 96.9% |
| Panamanians | 27.3 /100 | #191 | Fair 96.9% |
| Hawaiians | 27.0 /100 | #192 | Fair 96.9% |
| Paraguayans | 26.6 /100 | #193 | Fair 96.9% |
| Immigrants | Lebanon | 25.6 /100 | #194 | Fair 96.9% |
| Immigrants | Brazil | 25.5 /100 | #195 | Fair 96.9% |
| Immigrants | Uganda | 21.2 /100 | #196 | Fair 96.9% |
| Brazilians | 20.1 /100 | #197 | Fair 96.9% |
| Immigrants | Albania | 18.8 /100 | #198 | Poor 96.9% |
| Immigrants | Northern Africa | 15.7 /100 | #199 | Poor 96.9% |
| Africans | 14.8 /100 | #200 | Poor 96.9% |
| Immigrants | Zaire | 14.5 /100 | #201 | Poor 96.9% |
| Immigrants | Chile | 14.2 /100 | #202 | Poor 96.8% |
| Sudanese | 13.9 /100 | #203 | Poor 96.8% |
| Immigrants | Bahamas | 13.8 /100 | #204 | Poor 96.8% |
| Natives/Alaskans | 13.0 /100 | #205 | Poor 96.8% |
| Laotians | 11.8 /100 | #206 | Poor 96.8% |
| Iraqis | 11.7 /100 | #207 | Poor 96.8% |
| Samoans | 11.0 /100 | #208 | Poor 96.8% |
| Immigrants | Oceania | 11.0 /100 | #209 | Poor 96.8% |
| Immigrants | Nepal | 10.1 /100 | #210 | Poor 96.8% |