British West Indian vs Native/Alaskan 6th Grade
COMPARE
British West Indian
Native/Alaskan
6th Grade
6th Grade Comparison
British West Indians
Natives/Alaskans
96.0%
6TH GRADE
0.0/ 100
METRIC RATING
294th/ 347
METRIC RANK
96.8%
6TH GRADE
13.0/ 100
METRIC RATING
205th/ 347
METRIC RANK
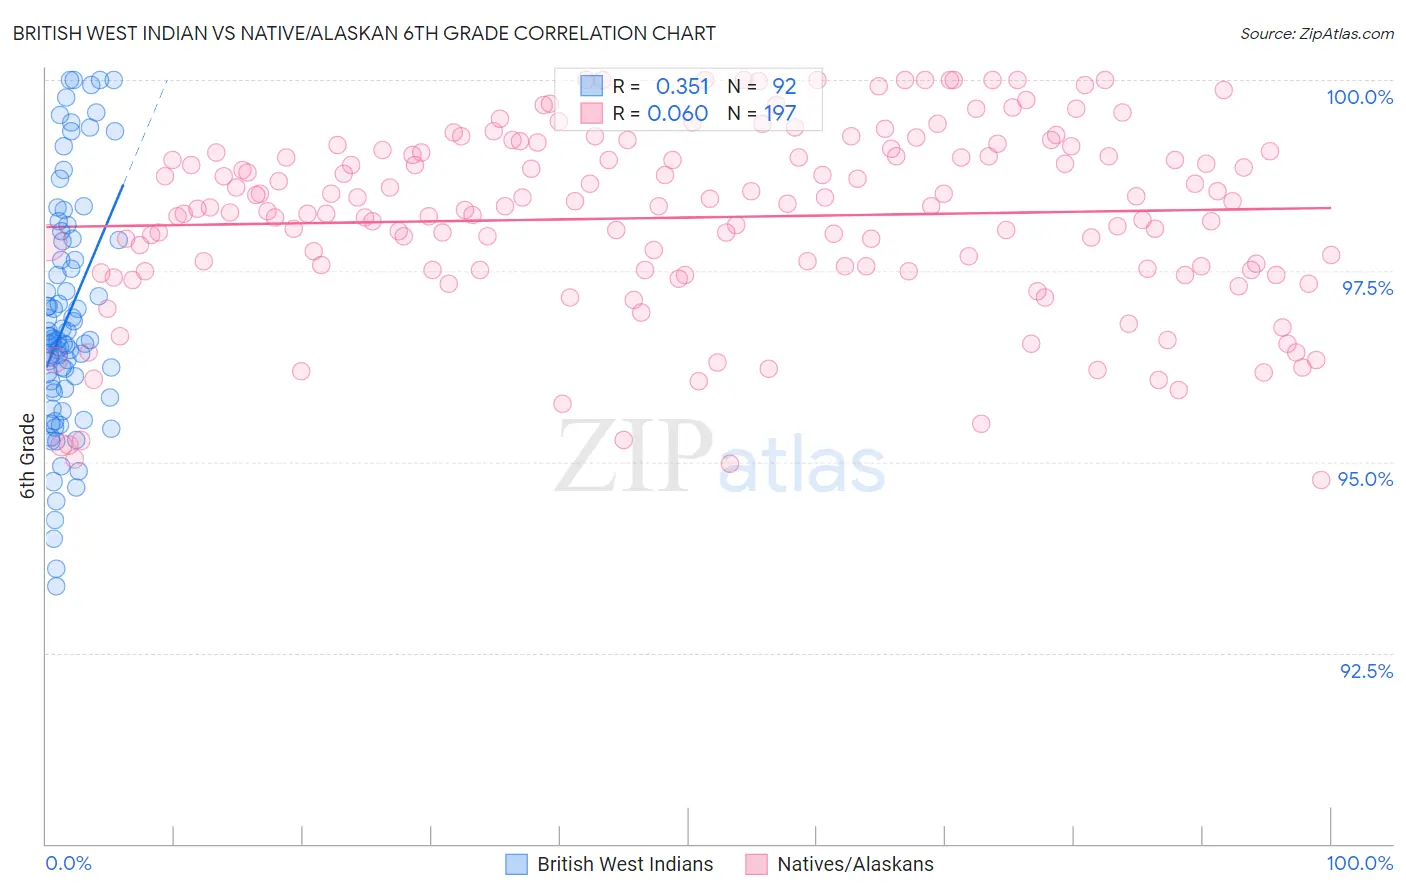
British West Indian vs Native/Alaskan 6th Grade Correlation Chart
The statistical analysis conducted on geographies consisting of 152,691,173 people shows a mild positive correlation between the proportion of British West Indians and percentage of population with at least 6th grade education in the United States with a correlation coefficient (R) of 0.351 and weighted average of 96.0%. Similarly, the statistical analysis conducted on geographies consisting of 513,056,654 people shows a slight positive correlation between the proportion of Natives/Alaskans and percentage of population with at least 6th grade education in the United States with a correlation coefficient (R) of 0.060 and weighted average of 96.8%, a difference of 0.87%.
6th Grade Correlation Summary
| Measurement | British West Indian | Native/Alaskan |
| Minimum | 93.4% | 94.8% |
| Maximum | 100.0% | 100.0% |
| Range | 6.6% | 5.2% |
| Mean | 96.9% | 98.2% |
| Median | 96.6% | 98.3% |
| Interquartile 25% (IQ1) | 95.9% | 97.5% |
| Interquartile 75% (IQ3) | 97.9% | 99.1% |
| Interquartile Range (IQR) | 2.0% | 1.6% |
| Standard Deviation (Sample) | 1.6% | 1.2% |
| Standard Deviation (Population) | 1.5% | 1.2% |
Similar Demographics by 6th Grade
Demographics Similar to British West Indians by 6th Grade
In terms of 6th grade, the demographic groups most similar to British West Indians are Immigrants from West Indies (96.1%, a difference of 0.070%), Immigrants from Grenada (95.9%, a difference of 0.070%), Immigrants from South Eastern Asia (95.9%, a difference of 0.070%), Immigrants from Barbados (96.1%, a difference of 0.10%), and Immigrants from St. Vincent and the Grenadines (96.1%, a difference of 0.12%).
| Demographics | Rating | Rank | 6th Grade |
| Immigrants | Trinidad and Tobago | 0.0 /100 | #287 | Tragic 96.2% |
| Malaysians | 0.0 /100 | #288 | Tragic 96.2% |
| Immigrants | Eritrea | 0.0 /100 | #289 | Tragic 96.1% |
| Immigrants | Somalia | 0.0 /100 | #290 | Tragic 96.1% |
| Immigrants | St. Vincent and the Grenadines | 0.0 /100 | #291 | Tragic 96.1% |
| Immigrants | Barbados | 0.0 /100 | #292 | Tragic 96.1% |
| Immigrants | West Indies | 0.0 /100 | #293 | Tragic 96.1% |
| British West Indians | 0.0 /100 | #294 | Tragic 96.0% |
| Immigrants | Grenada | 0.0 /100 | #295 | Tragic 95.9% |
| Immigrants | South Eastern Asia | 0.0 /100 | #296 | Tragic 95.9% |
| Haitians | 0.0 /100 | #297 | Tragic 95.8% |
| Sri Lankans | 0.0 /100 | #298 | Tragic 95.8% |
| Immigrants | Laos | 0.0 /100 | #299 | Tragic 95.7% |
| Immigrants | Dominica | 0.0 /100 | #300 | Tragic 95.7% |
| Immigrants | Immigrants | 0.0 /100 | #301 | Tragic 95.7% |
Demographics Similar to Natives/Alaskans by 6th Grade
In terms of 6th grade, the demographic groups most similar to Natives/Alaskans are Immigrants from Zaire (96.9%, a difference of 0.010%), Immigrants from Chile (96.8%, a difference of 0.010%), Sudanese (96.8%, a difference of 0.010%), Immigrants from Bahamas (96.8%, a difference of 0.010%), and Laotian (96.8%, a difference of 0.010%).
| Demographics | Rating | Rank | 6th Grade |
| Immigrants | Albania | 18.8 /100 | #198 | Poor 96.9% |
| Immigrants | Northern Africa | 15.7 /100 | #199 | Poor 96.9% |
| Africans | 14.8 /100 | #200 | Poor 96.9% |
| Immigrants | Zaire | 14.5 /100 | #201 | Poor 96.9% |
| Immigrants | Chile | 14.2 /100 | #202 | Poor 96.8% |
| Sudanese | 13.9 /100 | #203 | Poor 96.8% |
| Immigrants | Bahamas | 13.8 /100 | #204 | Poor 96.8% |
| Natives/Alaskans | 13.0 /100 | #205 | Poor 96.8% |
| Laotians | 11.8 /100 | #206 | Poor 96.8% |
| Iraqis | 11.7 /100 | #207 | Poor 96.8% |
| Samoans | 11.0 /100 | #208 | Poor 96.8% |
| Immigrants | Oceania | 11.0 /100 | #209 | Poor 96.8% |
| Immigrants | Nepal | 10.1 /100 | #210 | Poor 96.8% |
| Immigrants | Iraq | 9.2 /100 | #211 | Tragic 96.8% |
| Moroccans | 9.0 /100 | #212 | Tragic 96.8% |