Native Hawaiian vs Immigrants from Turkey 6th Grade
COMPARE
Native Hawaiian
Immigrants from Turkey
6th Grade
6th Grade Comparison
Native Hawaiians
Immigrants from Turkey
97.8%
6TH GRADE
99.9/ 100
METRIC RATING
47th/ 347
METRIC RANK
97.3%
6TH GRADE
86.1/ 100
METRIC RATING
139th/ 347
METRIC RANK
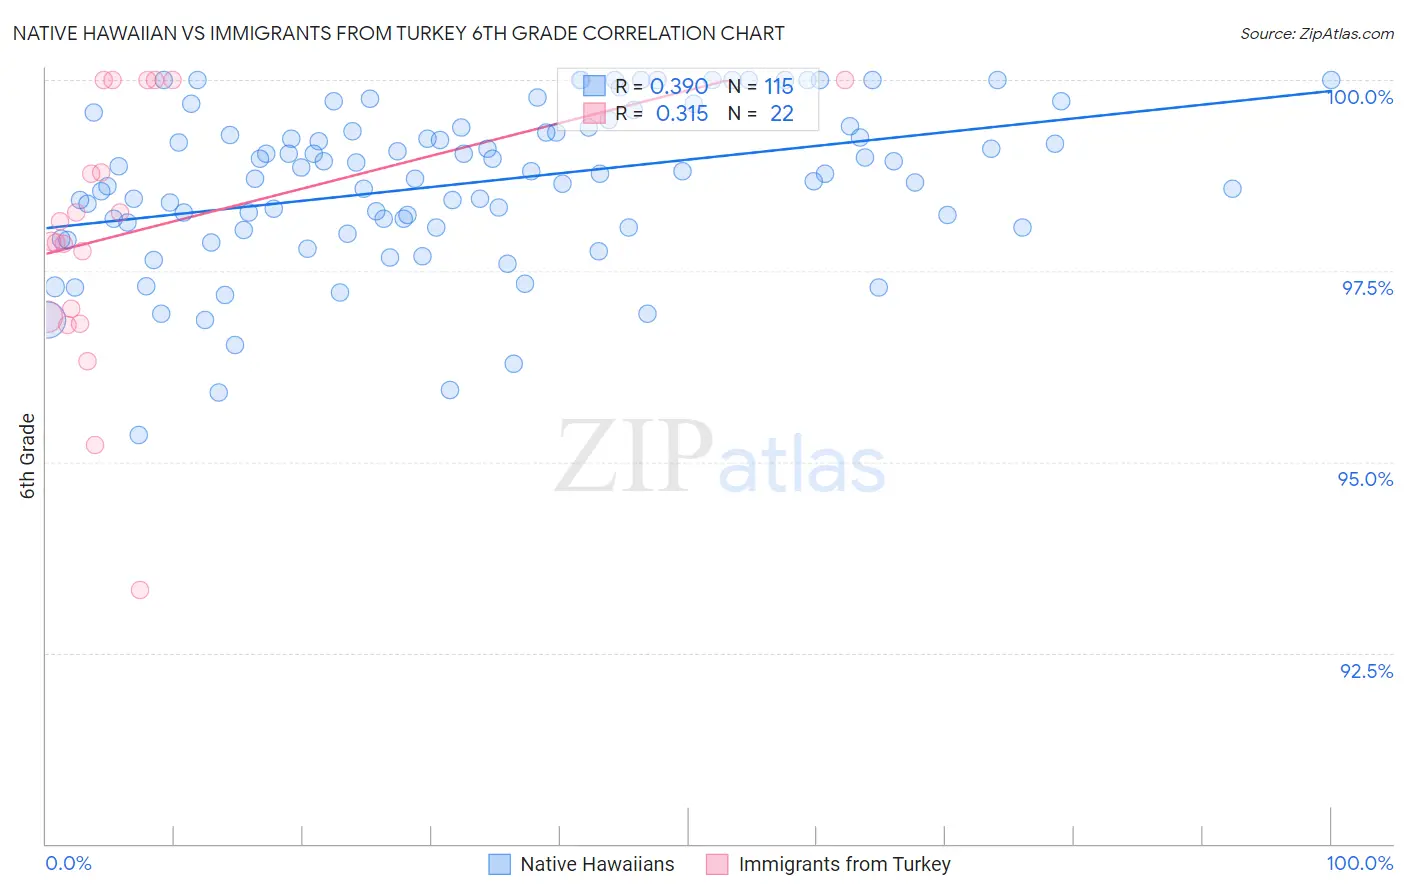
Native Hawaiian vs Immigrants from Turkey 6th Grade Correlation Chart
The statistical analysis conducted on geographies consisting of 332,114,258 people shows a mild positive correlation between the proportion of Native Hawaiians and percentage of population with at least 6th grade education in the United States with a correlation coefficient (R) of 0.390 and weighted average of 97.8%. Similarly, the statistical analysis conducted on geographies consisting of 223,057,877 people shows a mild positive correlation between the proportion of Immigrants from Turkey and percentage of population with at least 6th grade education in the United States with a correlation coefficient (R) of 0.315 and weighted average of 97.3%, a difference of 0.54%.
6th Grade Correlation Summary
| Measurement | Native Hawaiian | Immigrants from Turkey |
| Minimum | 95.3% | 93.3% |
| Maximum | 100.0% | 100.0% |
| Range | 4.7% | 6.7% |
| Mean | 98.6% | 98.0% |
| Median | 98.8% | 98.0% |
| Interquartile 25% (IQ1) | 98.1% | 96.9% |
| Interquartile 75% (IQ3) | 99.4% | 100.0% |
| Interquartile Range (IQR) | 1.3% | 3.1% |
| Standard Deviation (Sample) | 1.0% | 1.7% |
| Standard Deviation (Population) | 1.0% | 1.7% |
Similar Demographics by 6th Grade
Demographics Similar to Native Hawaiians by 6th Grade
In terms of 6th grade, the demographic groups most similar to Native Hawaiians are Celtic (97.8%, a difference of 0.0%), Estonian (97.8%, a difference of 0.0%), Immigrants from Scotland (97.8%, a difference of 0.0%), Arapaho (97.8%, a difference of 0.010%), and Maltese (97.8%, a difference of 0.010%).
| Demographics | Rating | Rank | 6th Grade |
| Latvians | 99.9 /100 | #40 | Exceptional 97.9% |
| Eastern Europeans | 99.9 /100 | #41 | Exceptional 97.9% |
| Hungarians | 99.9 /100 | #42 | Exceptional 97.8% |
| Northern Europeans | 99.9 /100 | #43 | Exceptional 97.8% |
| Czechoslovakians | 99.9 /100 | #44 | Exceptional 97.8% |
| Bulgarians | 99.9 /100 | #45 | Exceptional 97.8% |
| Arapaho | 99.9 /100 | #46 | Exceptional 97.8% |
| Native Hawaiians | 99.9 /100 | #47 | Exceptional 97.8% |
| Celtics | 99.9 /100 | #48 | Exceptional 97.8% |
| Estonians | 99.8 /100 | #49 | Exceptional 97.8% |
| Immigrants | Scotland | 99.8 /100 | #50 | Exceptional 97.8% |
| Maltese | 99.8 /100 | #51 | Exceptional 97.8% |
| Australians | 99.8 /100 | #52 | Exceptional 97.8% |
| Slavs | 99.8 /100 | #53 | Exceptional 97.8% |
| Creek | 99.8 /100 | #54 | Exceptional 97.7% |
Demographics Similar to Immigrants from Turkey by 6th Grade
In terms of 6th grade, the demographic groups most similar to Immigrants from Turkey are Immigrants from North Macedonia (97.2%, a difference of 0.010%), Seminole (97.2%, a difference of 0.010%), Jordanian (97.2%, a difference of 0.010%), Burmese (97.3%, a difference of 0.020%), and Blackfeet (97.3%, a difference of 0.020%).
| Demographics | Rating | Rank | 6th Grade |
| Palestinians | 90.9 /100 | #132 | Exceptional 97.3% |
| Immigrants | Moldova | 90.0 /100 | #133 | Excellent 97.3% |
| Immigrants | Kuwait | 89.5 /100 | #134 | Excellent 97.3% |
| Immigrants | Hungary | 89.5 /100 | #135 | Excellent 97.3% |
| Filipinos | 88.9 /100 | #136 | Excellent 97.3% |
| Burmese | 87.8 /100 | #137 | Excellent 97.3% |
| Blackfeet | 87.7 /100 | #138 | Excellent 97.3% |
| Immigrants | Turkey | 86.1 /100 | #139 | Excellent 97.3% |
| Immigrants | North Macedonia | 85.5 /100 | #140 | Excellent 97.2% |
| Seminole | 84.8 /100 | #141 | Excellent 97.2% |
| Jordanians | 84.6 /100 | #142 | Excellent 97.2% |
| Pima | 82.9 /100 | #143 | Excellent 97.2% |
| Israelis | 82.9 /100 | #144 | Excellent 97.2% |
| Spaniards | 80.1 /100 | #145 | Excellent 97.2% |
| Hopi | 78.8 /100 | #146 | Good 97.2% |