Puget Sound Salish vs Native/Alaskan 6th Grade

COMPARE

Puget Sound Salish
Race
Ancestry
AfghanAfricanAlaska NativeAlaskan AthabascanAlbanianAleutAlsatianAmericanApacheArabArapahoArgentineanArmenianAssyrian/Chaldean/SyriacAustralianAustrianBahamianBangladeshiBarbadianBasqueBelgianBelizeanBermudanBhutaneseBlackfeetBolivianBrazilianBritishBritish West IndianBulgarianBurmeseCajunCambodianCanadianCape VerdeanCarpatho RusynCelticCentral AmericanCentral American IndianCherokeeCheyenneChickasawChileanChineseChippewaChoctawColombianColvilleComancheCosta RicanCreeCreekCroatianCrowCubanCypriotCzechCzechoslovakianDanishDelawareDominicanDutchDutch West IndianEastern EuropeanEcuadorianEgyptianEnglishEstonianEthiopianEuropeanFijianFilipinoFinnishFrenchFrench American IndianFrench CanadianGermanGerman RussianGhanaianGreekGuamanian/ChamorroGuatemalanGuyaneseHaitianHmongHonduranHopiHoumaHungarianIcelanderIndian (Asian)IndonesianInupiatIranianIraqiIrishIroquoisIsraeliItalianJamaicanJapaneseJordanianKenyanKiowaKoreanLaotianLatvianLebaneseLiberianLithuanianLumbeeLuxembourgerMacedonianMalaysianMalteseMarshalleseMenomineeMexicanMexican American IndianMongolianMoroccanNative HawaiianNavajoNepaleseNew ZealanderNicaraguanNigerianNorthern EuropeanNorwegianOkinawanOsageOttawaPaiutePakistaniPalestinianPanamanianParaguayanPennsylvania GermanPeruvianPimaPolishPortuguesePotawatomiPuebloPuerto RicanPuget Sound SalishRomanianRussianSalvadoranSamoanScandinavianScotch-IrishScottishSeminoleSenegaleseSerbianShoshoneSierra LeoneanSiouxSlavicSlovakSloveneSomaliSouth AfricanSouth AmericanSouth American IndianSoviet UnionSpaniardSpanishSpanish AmericanSpanish American IndianSri LankanSubsaharan AfricanSudaneseSwedishSwissSyrianTaiwaneseThaiTlingit-HaidaTohono O'OdhamTonganTrinidadian and TobagonianTsimshianTurkishU.S. Virgin IslanderUgandanUkrainianUruguayanUteVenezuelanVietnameseWelshWest IndianYakamaYaquiYugoslavianYumanYup'ikZimbabwean
Immigration
NonimmigrantsImmigrantsAfghanistanAfricaAlbaniaArgentinaArmeniaAsiaAustraliaAustriaBahamasBangladeshBarbadosBelarusBelgiumBelizeBoliviaBosnia and HerzegovinaBrazilBulgariaBurma/MyanmarCabo VerdeCambodiaCameroonCanadaCaribbeanCentral AmericaChileChinaColombiaCongoCosta RicaCroatiaCubaCzechoslovakiaDenmarkDominicaDominican RepublicEastern AfricaEastern AsiaEastern EuropeEcuadorEgyptEl SalvadorEnglandEritreaEthiopiaEuropeFijiFranceGermanyGhanaGreeceGrenadaGuatemalaGuyanaHaitiHondurasHong KongHungaryIndiaIndonesiaIranIraqIrelandIsraelItalyJamaicaJapanJordanKazakhstanKenyaKoreaKuwaitLaosLatin AmericaLatviaLebanonLiberiaLithuaniaMalaysiaMexicoMicronesiaMiddle AfricaMoldovaMoroccoNepalNetherlandsNicaraguaNigeriaNorth AmericaNorth MacedoniaNorthern AfricaNorthern EuropeNorwayOceaniaPakistanPanamaPeruPhilippinesPolandPortugalRomaniaRussiaSaudi ArabiaScotlandSenegalSerbiaSierra LeoneSingaporeSomaliaSouth AfricaSouth AmericaSouth Central AsiaSouth Eastern AsiaSouthern EuropeSpainSri LankaSt. Vincent and the GrenadinesSudanSwedenSwitzerlandSyriaTaiwanThailandTrinidad and TobagoTurkeyUgandaUkraineUruguayUzbekistanVenezuelaVietnamWest IndiesWestern AfricaWestern AsiaWestern EuropeYemenZaireZimbabweAzores
Native/Alaskan
Race
Ancestry
AfghanAfricanAlaska NativeAlaskan AthabascanAlbanianAleutAlsatianAmericanApacheArabArapahoArgentineanArmenianAssyrian/Chaldean/SyriacAustralianAustrianBahamianBangladeshiBarbadianBasqueBelgianBelizeanBermudanBhutaneseBlackfeetBolivianBrazilianBritishBritish West IndianBulgarianBurmeseCajunCambodianCanadianCape VerdeanCarpatho RusynCelticCentral AmericanCentral American IndianCherokeeCheyenneChickasawChileanChineseChippewaChoctawColombianColvilleComancheCosta RicanCreeCreekCroatianCrowCubanCypriotCzechCzechoslovakianDanishDelawareDominicanDutchDutch West IndianEastern EuropeanEcuadorianEgyptianEnglishEstonianEthiopianEuropeanFijianFilipinoFinnishFrenchFrench American IndianFrench CanadianGermanGerman RussianGhanaianGreekGuamanian/ChamorroGuatemalanGuyaneseHaitianHmongHonduranHopiHoumaHungarianIcelanderIndian (Asian)IndonesianInupiatIranianIraqiIrishIroquoisIsraeliItalianJamaicanJapaneseJordanianKenyanKiowaKoreanLaotianLatvianLebaneseLiberianLithuanianLumbeeLuxembourgerMacedonianMalaysianMalteseMarshalleseMenomineeMexicanMexican American IndianMongolianMoroccanNative HawaiianNavajoNepaleseNew ZealanderNicaraguanNigerianNorthern EuropeanNorwegianOkinawanOsageOttawaPaiutePakistaniPalestinianPanamanianParaguayanPennsylvania GermanPeruvianPimaPolishPortuguesePotawatomiPuebloPuerto RicanRomanianRussianSalvadoranSamoanScandinavianScotch-IrishScottishSeminoleSenegaleseSerbianShoshoneSierra LeoneanSiouxSlavicSlovakSloveneSomaliSouth AfricanSouth AmericanSouth American IndianSoviet UnionSpaniardSpanishSpanish AmericanSpanish American IndianSri LankanSubsaharan AfricanSudaneseSwedishSwissSyrianTaiwaneseThaiTlingit-HaidaTohono O'OdhamTonganTrinidadian and TobagonianTsimshianTurkishU.S. Virgin IslanderUgandanUkrainianUruguayanUteVenezuelanVietnameseWelshWest IndianYakamaYaquiYugoslavianYumanYup'ikZimbabwean
Immigration
NonimmigrantsImmigrantsAfghanistanAfricaAlbaniaArgentinaArmeniaAsiaAustraliaAustriaBahamasBangladeshBarbadosBelarusBelgiumBelizeBoliviaBosnia and HerzegovinaBrazilBulgariaBurma/MyanmarCabo VerdeCambodiaCameroonCanadaCaribbeanCentral AmericaChileChinaColombiaCongoCosta RicaCroatiaCubaCzechoslovakiaDenmarkDominicaDominican RepublicEastern AfricaEastern AsiaEastern EuropeEcuadorEgyptEl SalvadorEnglandEritreaEthiopiaEuropeFijiFranceGermanyGhanaGreeceGrenadaGuatemalaGuyanaHaitiHondurasHong KongHungaryIndiaIndonesiaIranIraqIrelandIsraelItalyJamaicaJapanJordanKazakhstanKenyaKoreaKuwaitLaosLatin AmericaLatviaLebanonLiberiaLithuaniaMalaysiaMexicoMicronesiaMiddle AfricaMoldovaMoroccoNepalNetherlandsNicaraguaNigeriaNorth AmericaNorth MacedoniaNorthern AfricaNorthern EuropeNorwayOceaniaPakistanPanamaPeruPhilippinesPolandPortugalRomaniaRussiaSaudi ArabiaScotlandSenegalSerbiaSierra LeoneSingaporeSomaliaSouth AfricaSouth AmericaSouth Central AsiaSouth Eastern AsiaSouthern EuropeSpainSri LankaSt. Vincent and the GrenadinesSudanSwedenSwitzerlandSyriaTaiwanThailandTrinidad and TobagoTurkeyUgandaUkraineUruguayUzbekistanVenezuelaVietnamWest IndiesWestern AfricaWestern AsiaWestern EuropeYemenZaireZimbabweAzores
6th Grade
Income
Poverty
Unemployment
Labor Participation
Family Structure
Vehicle Availability
Education Level
Disability

6th Grade Comparison

Puget Sound Salish

Natives/Alaskans

Exceptional
Poor
97.5%
6TH GRADE
98.9/ 100
METRIC RATING
87th/ 347
METRIC RANK
96.8%
6TH GRADE
13.0/ 100
METRIC RATING
205th/ 347
METRIC RANK

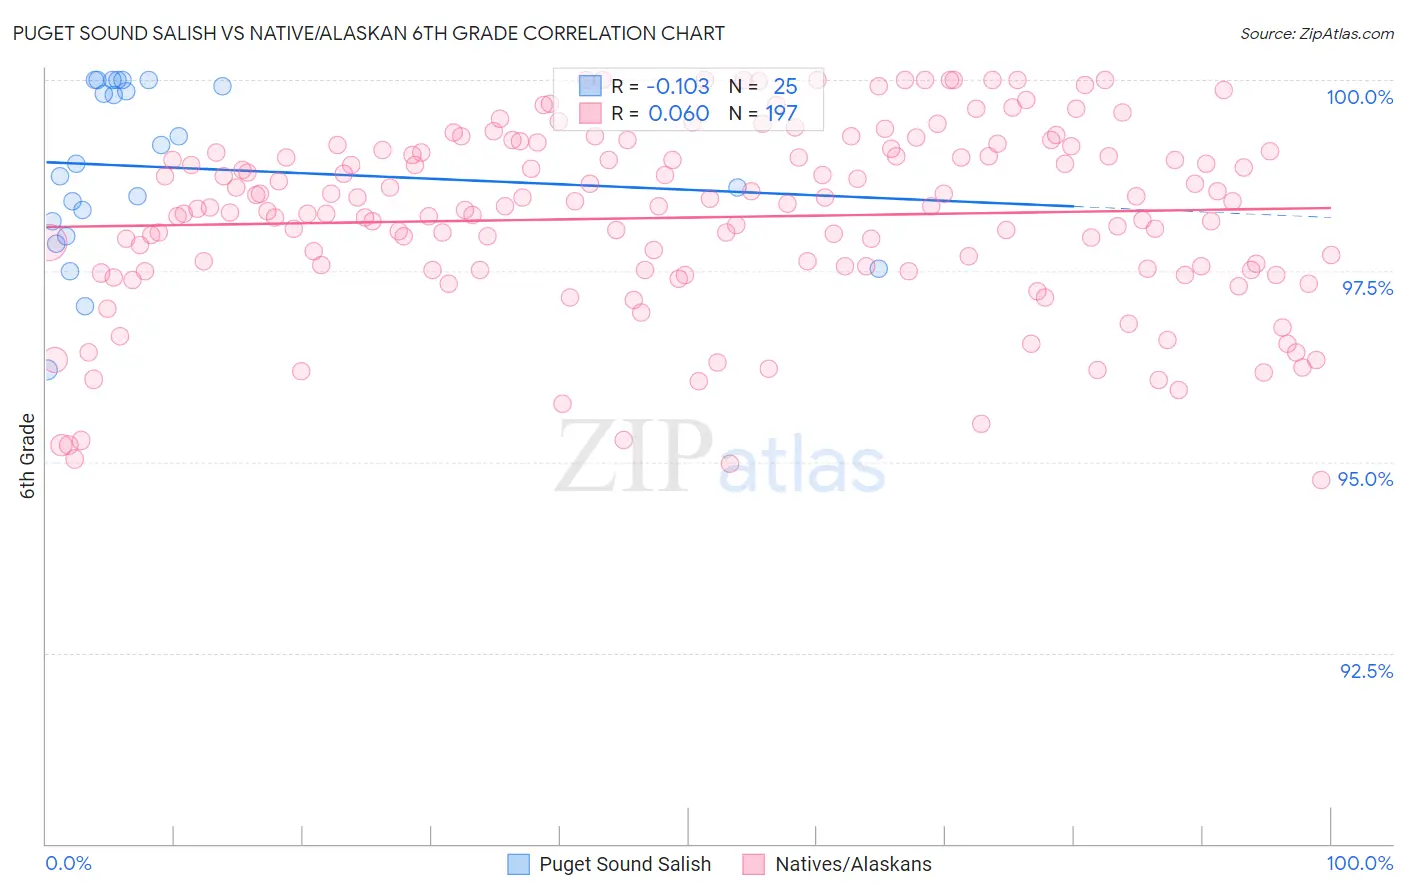
Puget Sound Salish vs Native/Alaskan 6th Grade Correlation Chart

The statistical analysis conducted on geographies consisting of 46,155,746 people shows a poor negative correlation between the proportion of Puget Sound Salish and percentage of population with at least 6th grade education in the United States with a correlation coefficient (R) of -0.103 and weighted average of 97.5%. Similarly, the statistical analysis conducted on geographies consisting of 513,056,654 people shows a slight positive correlation between the proportion of Natives/Alaskans and percentage of population with at least 6th grade education in the United States with a correlation coefficient (R) of 0.060 and weighted average of 96.8%, a difference of 0.73%.
Puget Sound Salish vs Native/Alaskan 6th Grade

6th Grade Correlation Summary

MeasurementPuget Sound SalishNative/Alaskan
Minimum96.2%94.8%
Maximum100.0%100.0%
Range3.8%5.2%
Mean98.9%98.2%
Median98.9%98.3%
Interquartile 25% (IQ1)98.1%97.5%
Interquartile 75% (IQ3)100.0%99.1%
Interquartile Range (IQR)1.9%1.6%
Standard Deviation (Sample)1.1%1.2%
Standard Deviation (Population)1.1%1.2%

Similar Demographics by 6th Grade

Demographics Similar to Puget Sound Salish by 6th Grade

In terms of 6th grade, the demographic groups most similar to Puget Sound Salish are Immigrants from Belgium (97.5%, a difference of 0.0%), Immigrants from South Africa (97.5%, a difference of 0.0%), Immigrants from Australia (97.5%, a difference of 0.0%), Delaware (97.6%, a difference of 0.010%), and Pueblo (97.5%, a difference of 0.010%).
DemographicsRating | Rank6th Grade
Osage
99.3
/100
|
#80
Exceptional
97.6%
Lumbee
99.2
/100
|
#81
Exceptional
97.6%
Zimbabweans
99.1
/100
|
#82
Exceptional
97.6%
Potawatomi
99.1
/100
|
#83
Exceptional
97.6%
Shoshone
99.0
/100
|
#84
Exceptional
97.6%
Delaware
98.9
/100
|
#85
Exceptional
97.6%
Immigrants | Belgium
98.9
/100
|
#86
Exceptional
97.5%
Puget Sound Salish
98.9
/100
|
#87
Exceptional
97.5%
Immigrants | South Africa
98.9
/100
|
#88
Exceptional
97.5%
Immigrants | Australia
98.8
/100
|
#89
Exceptional
97.5%
Pueblo
98.8
/100
|
#90
Exceptional
97.5%
Immigrants | Western Europe
98.8
/100
|
#91
Exceptional
97.5%
Romanians
98.7
/100
|
#92
Exceptional
97.5%
Cree
98.7
/100
|
#93
Exceptional
97.5%
Cypriots
98.7
/100
|
#94
Exceptional
97.5%

Demographics Similar to Natives/Alaskans by 6th Grade

In terms of 6th grade, the demographic groups most similar to Natives/Alaskans are Immigrants from Zaire (96.9%, a difference of 0.010%), Immigrants from Chile (96.8%, a difference of 0.010%), Sudanese (96.8%, a difference of 0.010%), Immigrants from Bahamas (96.8%, a difference of 0.010%), and Laotian (96.8%, a difference of 0.010%).
DemographicsRating | Rank6th Grade
Immigrants | Albania
18.8
/100
|
#198
Poor
96.9%
Immigrants | Northern Africa
15.7
/100
|
#199
Poor
96.9%
Africans
14.8
/100
|
#200
Poor
96.9%
Immigrants | Zaire
14.5
/100
|
#201
Poor
96.9%
Immigrants | Chile
14.2
/100
|
#202
Poor
96.8%
Sudanese
13.9
/100
|
#203
Poor
96.8%
Immigrants | Bahamas
13.8
/100
|
#204
Poor
96.8%
Natives/Alaskans
13.0
/100
|
#205
Poor
96.8%
Laotians
11.8
/100
|
#206
Poor
96.8%
Iraqis
11.7
/100
|
#207
Poor
96.8%
Samoans
11.0
/100
|
#208
Poor
96.8%
Immigrants | Oceania
11.0
/100
|
#209
Poor
96.8%
Immigrants | Nepal
10.1
/100
|
#210
Poor
96.8%
Immigrants | Iraq
9.2
/100
|
#211
Tragic
96.8%
Moroccans
9.0
/100
|
#212
Tragic
96.8%