Native Hawaiian vs Slovak 6th Grade
COMPARE
Native Hawaiian
Slovak
6th Grade
6th Grade Comparison
Native Hawaiians
Slovaks
97.8%
6TH GRADE
99.9/ 100
METRIC RATING
47th/ 347
METRIC RANK
98.2%
6TH GRADE
100.0/ 100
METRIC RATING
8th/ 347
METRIC RANK
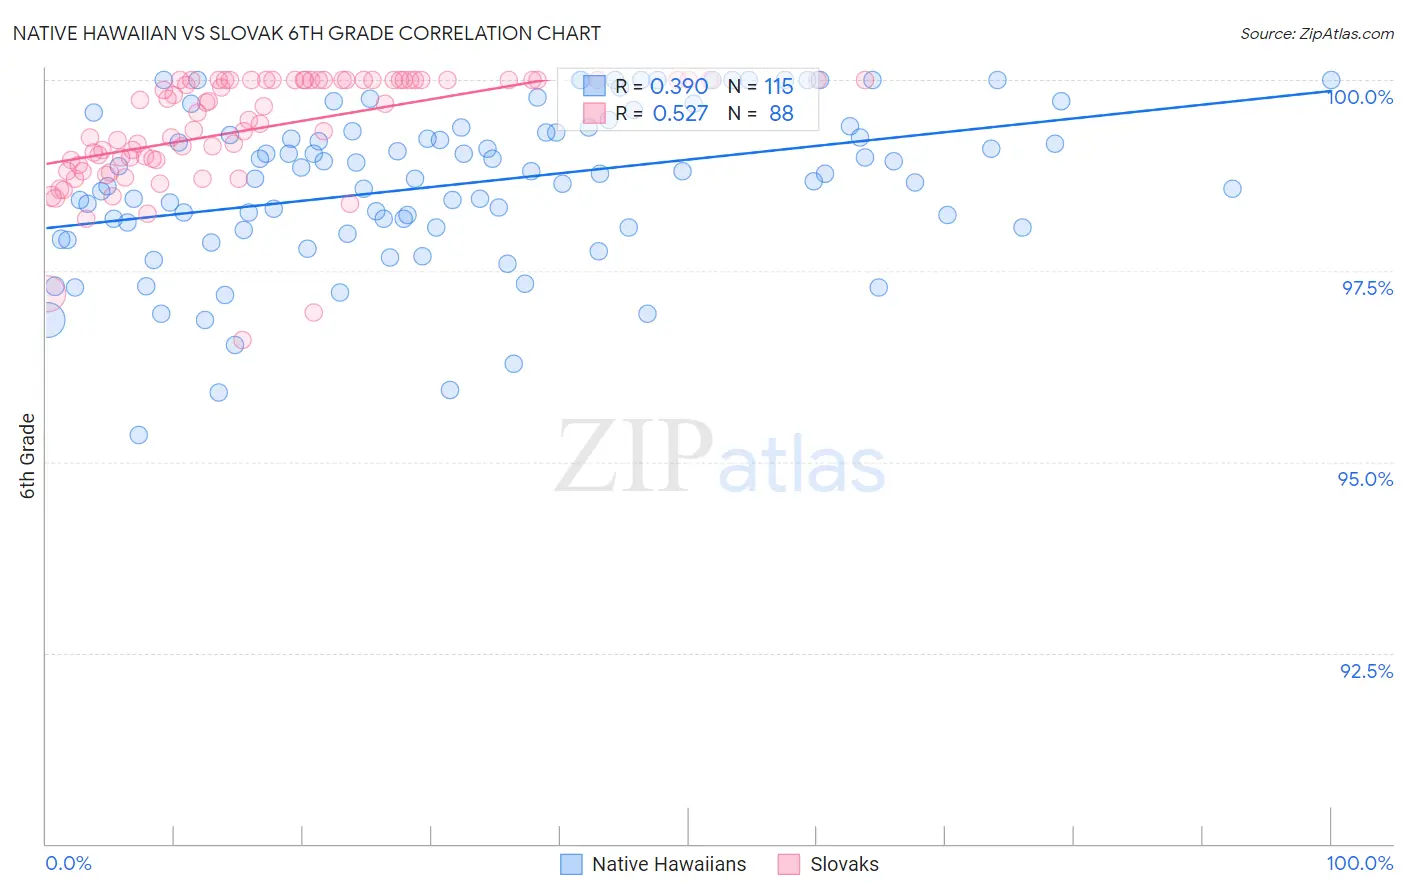
Native Hawaiian vs Slovak 6th Grade Correlation Chart
The statistical analysis conducted on geographies consisting of 332,114,258 people shows a mild positive correlation between the proportion of Native Hawaiians and percentage of population with at least 6th grade education in the United States with a correlation coefficient (R) of 0.390 and weighted average of 97.8%. Similarly, the statistical analysis conducted on geographies consisting of 397,890,986 people shows a substantial positive correlation between the proportion of Slovaks and percentage of population with at least 6th grade education in the United States with a correlation coefficient (R) of 0.527 and weighted average of 98.2%, a difference of 0.48%.
6th Grade Correlation Summary
| Measurement | Native Hawaiian | Slovak |
| Minimum | 95.3% | 96.6% |
| Maximum | 100.0% | 100.0% |
| Range | 4.7% | 3.4% |
| Mean | 98.6% | 99.4% |
| Median | 98.8% | 99.6% |
| Interquartile 25% (IQ1) | 98.1% | 99.0% |
| Interquartile 75% (IQ3) | 99.4% | 100.0% |
| Interquartile Range (IQR) | 1.3% | 1.0% |
| Standard Deviation (Sample) | 1.0% | 0.73% |
| Standard Deviation (Population) | 1.0% | 0.73% |
Similar Demographics by 6th Grade
Demographics Similar to Native Hawaiians by 6th Grade
In terms of 6th grade, the demographic groups most similar to Native Hawaiians are Celtic (97.8%, a difference of 0.0%), Estonian (97.8%, a difference of 0.0%), Immigrants from Scotland (97.8%, a difference of 0.0%), Arapaho (97.8%, a difference of 0.010%), and Maltese (97.8%, a difference of 0.010%).
| Demographics | Rating | Rank | 6th Grade |
| Latvians | 99.9 /100 | #40 | Exceptional 97.9% |
| Eastern Europeans | 99.9 /100 | #41 | Exceptional 97.9% |
| Hungarians | 99.9 /100 | #42 | Exceptional 97.8% |
| Northern Europeans | 99.9 /100 | #43 | Exceptional 97.8% |
| Czechoslovakians | 99.9 /100 | #44 | Exceptional 97.8% |
| Bulgarians | 99.9 /100 | #45 | Exceptional 97.8% |
| Arapaho | 99.9 /100 | #46 | Exceptional 97.8% |
| Native Hawaiians | 99.9 /100 | #47 | Exceptional 97.8% |
| Celtics | 99.9 /100 | #48 | Exceptional 97.8% |
| Estonians | 99.8 /100 | #49 | Exceptional 97.8% |
| Immigrants | Scotland | 99.8 /100 | #50 | Exceptional 97.8% |
| Maltese | 99.8 /100 | #51 | Exceptional 97.8% |
| Australians | 99.8 /100 | #52 | Exceptional 97.8% |
| Slavs | 99.8 /100 | #53 | Exceptional 97.8% |
| Creek | 99.8 /100 | #54 | Exceptional 97.7% |
Demographics Similar to Slovaks by 6th Grade
In terms of 6th grade, the demographic groups most similar to Slovaks are German (98.2%, a difference of 0.0%), Norwegian (98.3%, a difference of 0.040%), Tsimshian (98.3%, a difference of 0.050%), Slovene (98.2%, a difference of 0.050%), and Swedish (98.2%, a difference of 0.080%).
| Demographics | Rating | Rank | 6th Grade |
| Crow | 100.0 /100 | #1 | Exceptional 99.4% |
| Ottawa | 100.0 /100 | #2 | Exceptional 98.5% |
| Welsh | 100.0 /100 | #3 | Exceptional 98.5% |
| Dutch | 100.0 /100 | #4 | Exceptional 98.4% |
| Tsimshian | 100.0 /100 | #5 | Exceptional 98.3% |
| Norwegians | 100.0 /100 | #6 | Exceptional 98.3% |
| Germans | 100.0 /100 | #7 | Exceptional 98.2% |
| Slovaks | 100.0 /100 | #8 | Exceptional 98.2% |
| Slovenes | 100.0 /100 | #9 | Exceptional 98.2% |
| Swedes | 100.0 /100 | #10 | Exceptional 98.2% |
| English | 100.0 /100 | #11 | Exceptional 98.1% |
| Alaskan Athabascans | 100.0 /100 | #12 | Exceptional 98.1% |
| Tlingit-Haida | 100.0 /100 | #13 | Exceptional 98.1% |
| Carpatho Rusyns | 100.0 /100 | #14 | Exceptional 98.1% |
| Inupiat | 100.0 /100 | #15 | Exceptional 98.1% |