Native Hawaiian vs Native/Alaskan Child Poverty Under the Age of 16

COMPARE

Native Hawaiian
Race
Ancestry
AfghanAfricanAlaska NativeAlaskan AthabascanAlbanianAleutAlsatianAmericanApacheArabArapahoArgentineanArmenianAssyrian/Chaldean/SyriacAustralianAustrianBahamianBangladeshiBarbadianBasqueBelgianBelizeanBermudanBhutaneseBlackfeetBolivianBrazilianBritishBritish West IndianBulgarianBurmeseCajunCambodianCanadianCape VerdeanCarpatho RusynCelticCentral AmericanCentral American IndianCherokeeCheyenneChickasawChileanChineseChippewaChoctawColombianColvilleComancheCosta RicanCreeCreekCroatianCrowCubanCypriotCzechCzechoslovakianDanishDelawareDominicanDutchDutch West IndianEastern EuropeanEcuadorianEgyptianEnglishEstonianEthiopianEuropeanFijianFilipinoFinnishFrenchFrench American IndianFrench CanadianGermanGerman RussianGhanaianGreekGuamanian/ChamorroGuatemalanGuyaneseHaitianHmongHonduranHopiHoumaHungarianIcelanderIndian (Asian)IndonesianInupiatIranianIraqiIrishIroquoisIsraeliItalianJamaicanJapaneseJordanianKenyanKiowaKoreanLaotianLatvianLebaneseLiberianLithuanianLumbeeLuxembourgerMacedonianMalaysianMalteseMarshalleseMenomineeMexicanMexican American IndianMongolianMoroccanNative HawaiianNavajoNepaleseNew ZealanderNicaraguanNigerianNorthern EuropeanNorwegianOkinawanOsageOttawaPaiutePakistaniPalestinianPanamanianParaguayanPennsylvania GermanPeruvianPimaPolishPortuguesePotawatomiPuebloPuerto RicanPuget Sound SalishRomanianRussianSalvadoranSamoanScandinavianScotch-IrishScottishSeminoleSenegaleseSerbianShoshoneSierra LeoneanSiouxSlavicSlovakSloveneSomaliSouth AfricanSouth AmericanSouth American IndianSoviet UnionSpaniardSpanishSpanish AmericanSpanish American IndianSri LankanSubsaharan AfricanSudaneseSwedishSwissSyrianTaiwaneseThaiTlingit-HaidaTohono O'OdhamTonganTrinidadian and TobagonianTsimshianTurkishU.S. Virgin IslanderUgandanUkrainianUruguayanUteVenezuelanVietnameseWelshWest IndianYakamaYaquiYugoslavianYumanYup'ikZimbabwean
Immigration
NonimmigrantsImmigrantsAfghanistanAfricaAlbaniaArgentinaArmeniaAsiaAustraliaAustriaBahamasBangladeshBarbadosBelarusBelgiumBelizeBoliviaBosnia and HerzegovinaBrazilBulgariaBurma/MyanmarCabo VerdeCambodiaCameroonCanadaCaribbeanCentral AmericaChileChinaColombiaCongoCosta RicaCroatiaCubaCzechoslovakiaDenmarkDominicaDominican RepublicEastern AfricaEastern AsiaEastern EuropeEcuadorEgyptEl SalvadorEnglandEritreaEthiopiaEuropeFijiFranceGermanyGhanaGreeceGrenadaGuatemalaGuyanaHaitiHondurasHong KongHungaryIndiaIndonesiaIranIraqIrelandIsraelItalyJamaicaJapanJordanKazakhstanKenyaKoreaKuwaitLaosLatin AmericaLatviaLebanonLiberiaLithuaniaMalaysiaMexicoMicronesiaMiddle AfricaMoldovaMoroccoNepalNetherlandsNicaraguaNigeriaNorth AmericaNorth MacedoniaNorthern AfricaNorthern EuropeNorwayOceaniaPakistanPanamaPeruPhilippinesPolandPortugalRomaniaRussiaSaudi ArabiaScotlandSenegalSerbiaSierra LeoneSingaporeSomaliaSouth AfricaSouth AmericaSouth Central AsiaSouth Eastern AsiaSouthern EuropeSpainSri LankaSt. Vincent and the GrenadinesSudanSwedenSwitzerlandSyriaTaiwanThailandTrinidad and TobagoTurkeyUgandaUkraineUruguayUzbekistanVenezuelaVietnamWest IndiesWestern AfricaWestern AsiaWestern EuropeYemenZaireZimbabweAzores
Native/Alaskan
Race
Ancestry
AfghanAfricanAlaska NativeAlaskan AthabascanAlbanianAleutAlsatianAmericanApacheArabArapahoArgentineanArmenianAssyrian/Chaldean/SyriacAustralianAustrianBahamianBangladeshiBarbadianBasqueBelgianBelizeanBermudanBhutaneseBlackfeetBolivianBrazilianBritishBritish West IndianBulgarianBurmeseCajunCambodianCanadianCape VerdeanCarpatho RusynCelticCentral AmericanCentral American IndianCherokeeCheyenneChickasawChileanChineseChippewaChoctawColombianColvilleComancheCosta RicanCreeCreekCroatianCrowCubanCypriotCzechCzechoslovakianDanishDelawareDominicanDutchDutch West IndianEastern EuropeanEcuadorianEgyptianEnglishEstonianEthiopianEuropeanFijianFilipinoFinnishFrenchFrench American IndianFrench CanadianGermanGerman RussianGhanaianGreekGuamanian/ChamorroGuatemalanGuyaneseHaitianHmongHonduranHopiHoumaHungarianIcelanderIndian (Asian)IndonesianInupiatIranianIraqiIrishIroquoisIsraeliItalianJamaicanJapaneseJordanianKenyanKiowaKoreanLaotianLatvianLebaneseLiberianLithuanianLumbeeLuxembourgerMacedonianMalaysianMalteseMarshalleseMenomineeMexicanMexican American IndianMongolianMoroccanNavajoNepaleseNew ZealanderNicaraguanNigerianNorthern EuropeanNorwegianOkinawanOsageOttawaPaiutePakistaniPalestinianPanamanianParaguayanPennsylvania GermanPeruvianPimaPolishPortuguesePotawatomiPuebloPuerto RicanPuget Sound SalishRomanianRussianSalvadoranSamoanScandinavianScotch-IrishScottishSeminoleSenegaleseSerbianShoshoneSierra LeoneanSiouxSlavicSlovakSloveneSomaliSouth AfricanSouth AmericanSouth American IndianSoviet UnionSpaniardSpanishSpanish AmericanSpanish American IndianSri LankanSubsaharan AfricanSudaneseSwedishSwissSyrianTaiwaneseThaiTlingit-HaidaTohono O'OdhamTonganTrinidadian and TobagonianTsimshianTurkishU.S. Virgin IslanderUgandanUkrainianUruguayanUteVenezuelanVietnameseWelshWest IndianYakamaYaquiYugoslavianYumanYup'ikZimbabwean
Immigration
NonimmigrantsImmigrantsAfghanistanAfricaAlbaniaArgentinaArmeniaAsiaAustraliaAustriaBahamasBangladeshBarbadosBelarusBelgiumBelizeBoliviaBosnia and HerzegovinaBrazilBulgariaBurma/MyanmarCabo VerdeCambodiaCameroonCanadaCaribbeanCentral AmericaChileChinaColombiaCongoCosta RicaCroatiaCubaCzechoslovakiaDenmarkDominicaDominican RepublicEastern AfricaEastern AsiaEastern EuropeEcuadorEgyptEl SalvadorEnglandEritreaEthiopiaEuropeFijiFranceGermanyGhanaGreeceGrenadaGuatemalaGuyanaHaitiHondurasHong KongHungaryIndiaIndonesiaIranIraqIrelandIsraelItalyJamaicaJapanJordanKazakhstanKenyaKoreaKuwaitLaosLatin AmericaLatviaLebanonLiberiaLithuaniaMalaysiaMexicoMicronesiaMiddle AfricaMoldovaMoroccoNepalNetherlandsNicaraguaNigeriaNorth AmericaNorth MacedoniaNorthern AfricaNorthern EuropeNorwayOceaniaPakistanPanamaPeruPhilippinesPolandPortugalRomaniaRussiaSaudi ArabiaScotlandSenegalSerbiaSierra LeoneSingaporeSomaliaSouth AfricaSouth AmericaSouth Central AsiaSouth Eastern AsiaSouthern EuropeSpainSri LankaSt. Vincent and the GrenadinesSudanSwedenSwitzerlandSyriaTaiwanThailandTrinidad and TobagoTurkeyUgandaUkraineUruguayUzbekistanVenezuelaVietnamWest IndiesWestern AfricaWestern AsiaWestern EuropeYemenZaireZimbabweAzores
Child Poverty Under the Age of 16
Income
Poverty
Unemployment
Labor Participation
Family Structure
Vehicle Availability
Education Level
Disability

Child Poverty Under the Age of 16 Comparison

Native Hawaiians

Natives/Alaskans

Excellent
Tragic
15.2%
CHILD POVERTY UNDER THE AGE OF 16
88.7/ 100
METRIC RATING
134th/ 347
METRIC RANK
23.8%
CHILD POVERTY UNDER THE AGE OF 16
0.0/ 100
METRIC RATING
330th/ 347
METRIC RANK

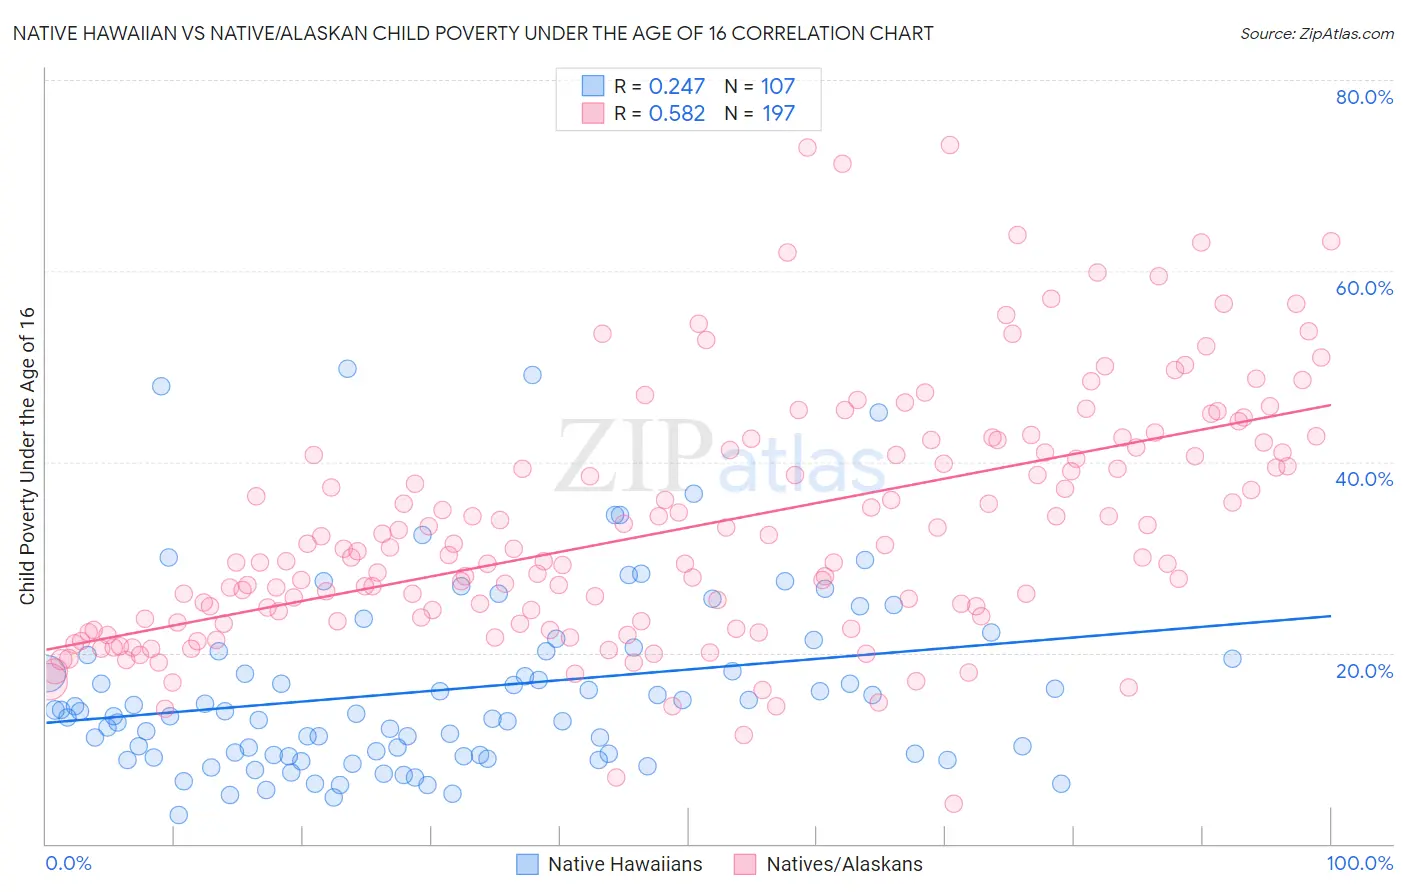
Native Hawaiian vs Native/Alaskan Child Poverty Under the Age of 16 Correlation Chart

The statistical analysis conducted on geographies consisting of 329,952,293 people shows a weak positive correlation between the proportion of Native Hawaiians and poverty level among children under the age of 16 in the United States with a correlation coefficient (R) of 0.247 and weighted average of 15.2%. Similarly, the statistical analysis conducted on geographies consisting of 507,337,670 people shows a substantial positive correlation between the proportion of Natives/Alaskans and poverty level among children under the age of 16 in the United States with a correlation coefficient (R) of 0.582 and weighted average of 23.8%, a difference of 56.5%.
Native Hawaiian vs Native/Alaskan Child Poverty Under the Age of 16

Child Poverty Under the Age of 16 Correlation Summary

MeasurementNative HawaiianNative/Alaskan
Minimum3.0%4.2%
Maximum49.7%73.1%
Range46.7%68.9%
Mean16.2%33.1%
Median13.6%30.2%
Interquartile 25% (IQ1)9.3%23.3%
Interquartile 75% (IQ3)20.2%41.1%
Interquartile Range (IQR)10.9%17.8%
Standard Deviation (Sample)9.7%12.8%
Standard Deviation (Population)9.7%12.8%

Similar Demographics by Child Poverty Under the Age of 16

Demographics Similar to Native Hawaiians by Child Poverty Under the Age of 16

In terms of child poverty under the age of 16, the demographic groups most similar to Native Hawaiians are Albanian (15.2%, a difference of 0.040%), Immigrants from South Eastern Asia (15.2%, a difference of 0.090%), Canadian (15.2%, a difference of 0.14%), Armenian (15.2%, a difference of 0.23%), and Mongolian (15.2%, a difference of 0.26%).
DemographicsRating | RankChild Poverty Under the Age of 16
Immigrants | Western Europe
90.3
/100
|
#127
Exceptional
15.1%
Immigrants | Kazakhstan
90.2
/100
|
#128
Exceptional
15.1%
Immigrants | Southern Europe
89.7
/100
|
#129
Excellent
15.1%
Mongolians
89.5
/100
|
#130
Excellent
15.2%
Armenians
89.4
/100
|
#131
Excellent
15.2%
Canadians
89.1
/100
|
#132
Excellent
15.2%
Immigrants | South Eastern Asia
89.0
/100
|
#133
Excellent
15.2%
Native Hawaiians
88.7
/100
|
#134
Excellent
15.2%
Albanians
88.6
/100
|
#135
Excellent
15.2%
Immigrants | Spain
87.3
/100
|
#136
Excellent
15.3%
Peruvians
87.2
/100
|
#137
Excellent
15.3%
Welsh
87.2
/100
|
#138
Excellent
15.3%
Immigrants | Vietnam
87.1
/100
|
#139
Excellent
15.3%
New Zealanders
86.9
/100
|
#140
Excellent
15.3%
Slavs
84.2
/100
|
#141
Excellent
15.4%

Demographics Similar to Natives/Alaskans by Child Poverty Under the Age of 16

In terms of child poverty under the age of 16, the demographic groups most similar to Natives/Alaskans are Dominican (23.8%, a difference of 0.090%), Apache (23.8%, a difference of 0.22%), Pueblo (23.9%, a difference of 0.60%), Immigrants from Dominican Republic (24.0%, a difference of 0.78%), and Black/African American (24.4%, a difference of 2.8%).
DemographicsRating | RankChild Poverty Under the Age of 16
Paiute
0.0
/100
|
#323
Tragic
22.4%
Central American Indians
0.0
/100
|
#324
Tragic
22.5%
Immigrants | Congo
0.0
/100
|
#325
Tragic
22.5%
Immigrants | Honduras
0.0
/100
|
#326
Tragic
22.7%
Menominee
0.0
/100
|
#327
Tragic
23.0%
Colville
0.0
/100
|
#328
Tragic
23.0%
Dominicans
0.0
/100
|
#329
Tragic
23.8%
Natives/Alaskans
0.0
/100
|
#330
Tragic
23.8%
Apache
0.0
/100
|
#331
Tragic
23.8%
Pueblo
0.0
/100
|
#332
Tragic
23.9%
Immigrants | Dominican Republic
0.0
/100
|
#333
Tragic
24.0%
Blacks/African Americans
0.0
/100
|
#334
Tragic
24.4%
Houma
0.0
/100
|
#335
Tragic
24.9%
Yup'ik
0.0
/100
|
#336
Tragic
25.1%
Sioux
0.0
/100
|
#337
Tragic
25.2%