Ecuadorian vs Immigrants from Zimbabwe 4th Grade
COMPARE
Ecuadorian
Immigrants from Zimbabwe
4th Grade
4th Grade Comparison
Ecuadorians
Immigrants from Zimbabwe
96.4%
4TH GRADE
0.0/ 100
METRIC RATING
304th/ 347
METRIC RANK
97.8%
4TH GRADE
93.9/ 100
METRIC RATING
123rd/ 347
METRIC RANK
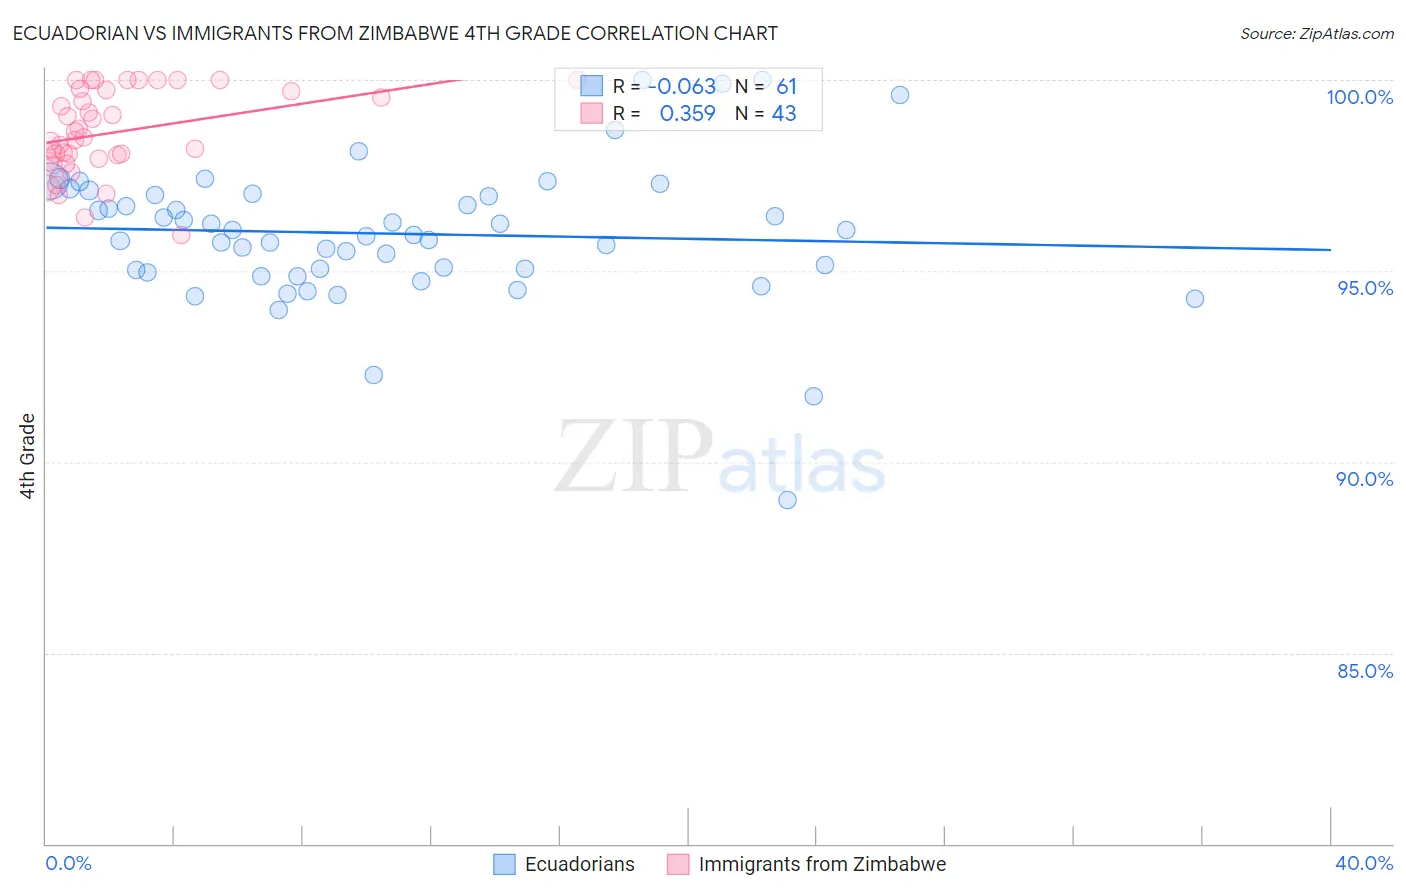
Ecuadorian vs Immigrants from Zimbabwe 4th Grade Correlation Chart
The statistical analysis conducted on geographies consisting of 317,865,723 people shows a slight negative correlation between the proportion of Ecuadorians and percentage of population with at least 4th grade education in the United States with a correlation coefficient (R) of -0.063 and weighted average of 96.4%. Similarly, the statistical analysis conducted on geographies consisting of 117,756,150 people shows a mild positive correlation between the proportion of Immigrants from Zimbabwe and percentage of population with at least 4th grade education in the United States with a correlation coefficient (R) of 0.359 and weighted average of 97.8%, a difference of 1.4%.
4th Grade Correlation Summary
| Measurement | Ecuadorian | Immigrants from Zimbabwe |
| Minimum | 89.0% | 95.9% |
| Maximum | 100.0% | 100.0% |
| Range | 11.0% | 4.1% |
| Mean | 96.0% | 98.6% |
| Median | 96.0% | 98.5% |
| Interquartile 25% (IQ1) | 95.0% | 98.0% |
| Interquartile 75% (IQ3) | 97.0% | 99.7% |
| Interquartile Range (IQR) | 2.0% | 1.8% |
| Standard Deviation (Sample) | 1.8% | 1.1% |
| Standard Deviation (Population) | 1.8% | 1.1% |
Similar Demographics by 4th Grade
Demographics Similar to Ecuadorians by 4th Grade
In terms of 4th grade, the demographic groups most similar to Ecuadorians are Guyanese (96.4%, a difference of 0.010%), Immigrants from Caribbean (96.4%, a difference of 0.020%), Sri Lankan (96.4%, a difference of 0.030%), Immigrants from Cuba (96.4%, a difference of 0.060%), and Immigrants from Haiti (96.3%, a difference of 0.060%).
| Demographics | Rating | Rank | 4th Grade |
| Immigrants | Somalia | 0.0 /100 | #297 | Tragic 96.5% |
| Haitians | 0.0 /100 | #298 | Tragic 96.5% |
| Immigrants | Dominica | 0.0 /100 | #299 | Tragic 96.5% |
| Immigrants | South Eastern Asia | 0.0 /100 | #300 | Tragic 96.5% |
| Immigrants | Immigrants | 0.0 /100 | #301 | Tragic 96.5% |
| Immigrants | Cuba | 0.0 /100 | #302 | Tragic 96.4% |
| Guyanese | 0.0 /100 | #303 | Tragic 96.4% |
| Ecuadorians | 0.0 /100 | #304 | Tragic 96.4% |
| Immigrants | Caribbean | 0.0 /100 | #305 | Tragic 96.4% |
| Sri Lankans | 0.0 /100 | #306 | Tragic 96.4% |
| Immigrants | Haiti | 0.0 /100 | #307 | Tragic 96.3% |
| Immigrants | Laos | 0.0 /100 | #308 | Tragic 96.3% |
| Immigrants | Guyana | 0.0 /100 | #309 | Tragic 96.3% |
| Immigrants | Burma/Myanmar | 0.0 /100 | #310 | Tragic 96.3% |
| Immigrants | Bangladesh | 0.0 /100 | #311 | Tragic 96.2% |
Demographics Similar to Immigrants from Zimbabwe by 4th Grade
In terms of 4th grade, the demographic groups most similar to Immigrants from Zimbabwe are Immigrants from Norway (97.8%, a difference of 0.0%), Immigrants from Japan (97.8%, a difference of 0.0%), Spanish (97.8%, a difference of 0.0%), Immigrants from France (97.8%, a difference of 0.010%), and Immigrants from Croatia (97.8%, a difference of 0.020%).
| Demographics | Rating | Rank | 4th Grade |
| Immigrants | Croatia | 95.2 /100 | #116 | Exceptional 97.8% |
| Syrians | 94.9 /100 | #117 | Exceptional 97.8% |
| Menominee | 94.9 /100 | #118 | Exceptional 97.8% |
| Immigrants | Saudi Arabia | 94.8 /100 | #119 | Exceptional 97.8% |
| Immigrants | France | 94.8 /100 | #120 | Exceptional 97.8% |
| Immigrants | Norway | 94.2 /100 | #121 | Exceptional 97.8% |
| Immigrants | Japan | 94.1 /100 | #122 | Exceptional 97.8% |
| Immigrants | Zimbabwe | 93.9 /100 | #123 | Exceptional 97.8% |
| Spanish | 93.7 /100 | #124 | Exceptional 97.8% |
| Immigrants | Serbia | 92.6 /100 | #125 | Exceptional 97.8% |
| Immigrants | Europe | 92.5 /100 | #126 | Exceptional 97.8% |
| Colville | 92.3 /100 | #127 | Exceptional 97.7% |
| Pima | 92.0 /100 | #128 | Exceptional 97.7% |
| Immigrants | Bulgaria | 91.3 /100 | #129 | Exceptional 97.7% |
| Immigrants | Romania | 90.6 /100 | #130 | Exceptional 97.7% |