Mexican American Indian vs Immigrants from Taiwan Kindergarten
COMPARE
Mexican American Indian
Immigrants from Taiwan
Kindergarten
Kindergarten Comparison
Mexican American Indians
Immigrants from Taiwan
96.8%
KINDERGARTEN
0.0/ 100
METRIC RATING
322nd/ 347
METRIC RANK
97.9%
KINDERGARTEN
30.7/ 100
METRIC RATING
191st/ 347
METRIC RANK
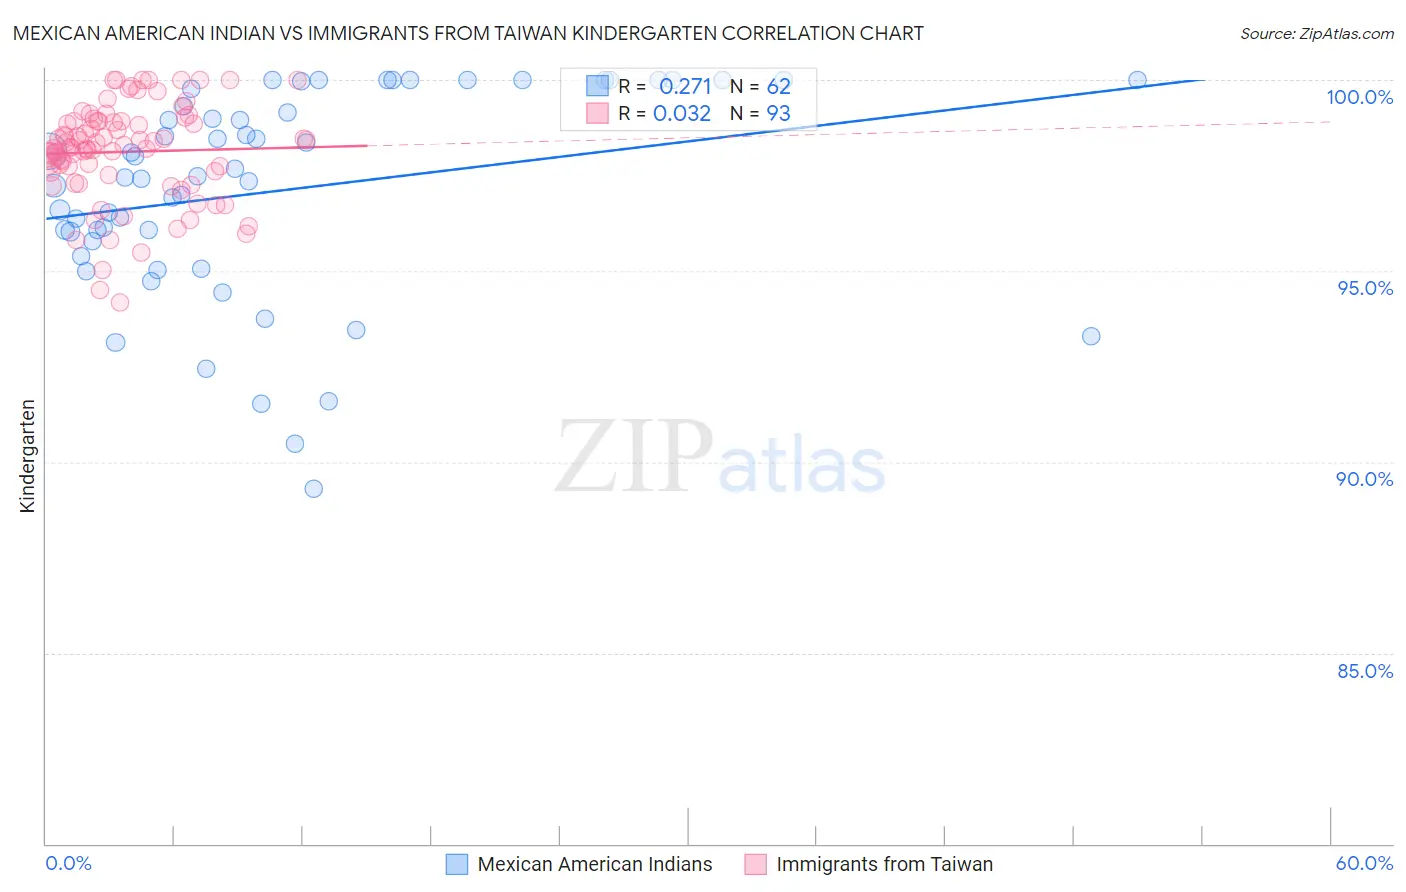
Mexican American Indian vs Immigrants from Taiwan Kindergarten Correlation Chart
The statistical analysis conducted on geographies consisting of 317,619,717 people shows a weak positive correlation between the proportion of Mexican American Indians and percentage of population with at least kindergarten education in the United States with a correlation coefficient (R) of 0.271 and weighted average of 96.8%. Similarly, the statistical analysis conducted on geographies consisting of 298,069,082 people shows no correlation between the proportion of Immigrants from Taiwan and percentage of population with at least kindergarten education in the United States with a correlation coefficient (R) of 0.032 and weighted average of 97.9%, a difference of 1.1%.
Kindergarten Correlation Summary
| Measurement | Mexican American Indian | Immigrants from Taiwan |
| Minimum | 89.3% | 94.2% |
| Maximum | 100.0% | 100.0% |
| Range | 10.7% | 5.8% |
| Mean | 97.1% | 98.1% |
| Median | 97.5% | 98.2% |
| Interquartile 25% (IQ1) | 95.8% | 97.6% |
| Interquartile 75% (IQ3) | 99.8% | 98.9% |
| Interquartile Range (IQR) | 4.0% | 1.4% |
| Standard Deviation (Sample) | 2.7% | 1.3% |
| Standard Deviation (Population) | 2.7% | 1.3% |
Similar Demographics by Kindergarten
Demographics Similar to Mexican American Indians by Kindergarten
In terms of kindergarten, the demographic groups most similar to Mexican American Indians are Immigrants from Bangladesh (96.8%, a difference of 0.010%), Immigrants from Honduras (96.8%, a difference of 0.010%), Immigrants from Guyana (96.8%, a difference of 0.020%), Immigrants from Burma/Myanmar (96.8%, a difference of 0.020%), and Vietnamese (96.8%, a difference of 0.020%).
| Demographics | Rating | Rank | Kindergarten |
| Immigrants | Belize | 0.0 /100 | #315 | Tragic 96.9% |
| Immigrants | Nicaragua | 0.0 /100 | #316 | Tragic 96.9% |
| Immigrants | Ecuador | 0.0 /100 | #317 | Tragic 96.9% |
| Immigrants | Laos | 0.0 /100 | #318 | Tragic 96.9% |
| Immigrants | Guyana | 0.0 /100 | #319 | Tragic 96.8% |
| Immigrants | Burma/Myanmar | 0.0 /100 | #320 | Tragic 96.8% |
| Immigrants | Bangladesh | 0.0 /100 | #321 | Tragic 96.8% |
| Mexican American Indians | 0.0 /100 | #322 | Tragic 96.8% |
| Immigrants | Honduras | 0.0 /100 | #323 | Tragic 96.8% |
| Vietnamese | 0.0 /100 | #324 | Tragic 96.8% |
| Indonesians | 0.0 /100 | #325 | Tragic 96.8% |
| Dominicans | 0.0 /100 | #326 | Tragic 96.8% |
| Mexicans | 0.0 /100 | #327 | Tragic 96.7% |
| Immigrants | Latin America | 0.0 /100 | #328 | Tragic 96.7% |
| Immigrants | Vietnam | 0.0 /100 | #329 | Tragic 96.7% |
Demographics Similar to Immigrants from Taiwan by Kindergarten
In terms of kindergarten, the demographic groups most similar to Immigrants from Taiwan are Black/African American (97.9%, a difference of 0.0%), Paraguayan (97.9%, a difference of 0.0%), Paiute (97.9%, a difference of 0.010%), Panamanian (97.9%, a difference of 0.010%), and Hawaiian (97.9%, a difference of 0.010%).
| Demographics | Rating | Rank | Kindergarten |
| Immigrants | Argentina | 40.7 /100 | #184 | Average 97.9% |
| Immigrants | Belarus | 39.4 /100 | #185 | Fair 97.9% |
| Pakistanis | 36.0 /100 | #186 | Fair 97.9% |
| Immigrants | Kazakhstan | 35.9 /100 | #187 | Fair 97.9% |
| Arabs | 35.4 /100 | #188 | Fair 97.9% |
| Paiute | 34.7 /100 | #189 | Fair 97.9% |
| Panamanians | 33.3 /100 | #190 | Fair 97.9% |
| Immigrants | Taiwan | 30.7 /100 | #191 | Fair 97.9% |
| Blacks/African Americans | 29.9 /100 | #192 | Fair 97.9% |
| Paraguayans | 29.6 /100 | #193 | Fair 97.9% |
| Hawaiians | 29.3 /100 | #194 | Fair 97.9% |
| Mongolians | 28.9 /100 | #195 | Fair 97.9% |
| Guamanians/Chamorros | 26.2 /100 | #196 | Fair 97.9% |
| Immigrants | Kenya | 25.5 /100 | #197 | Fair 97.9% |
| Tohono O'odham | 24.6 /100 | #198 | Fair 97.9% |