Marshallese vs Maltese GED/Equivalency
COMPARE
Marshallese
Maltese
GED/Equivalency
GED/Equivalency Comparison
Marshallese
Maltese
84.9%
GED/EQUIVALENCY
12.5/ 100
METRIC RATING
208th/ 347
METRIC RANK
88.6%
GED/EQUIVALENCY
99.9/ 100
METRIC RATING
20th/ 347
METRIC RANK
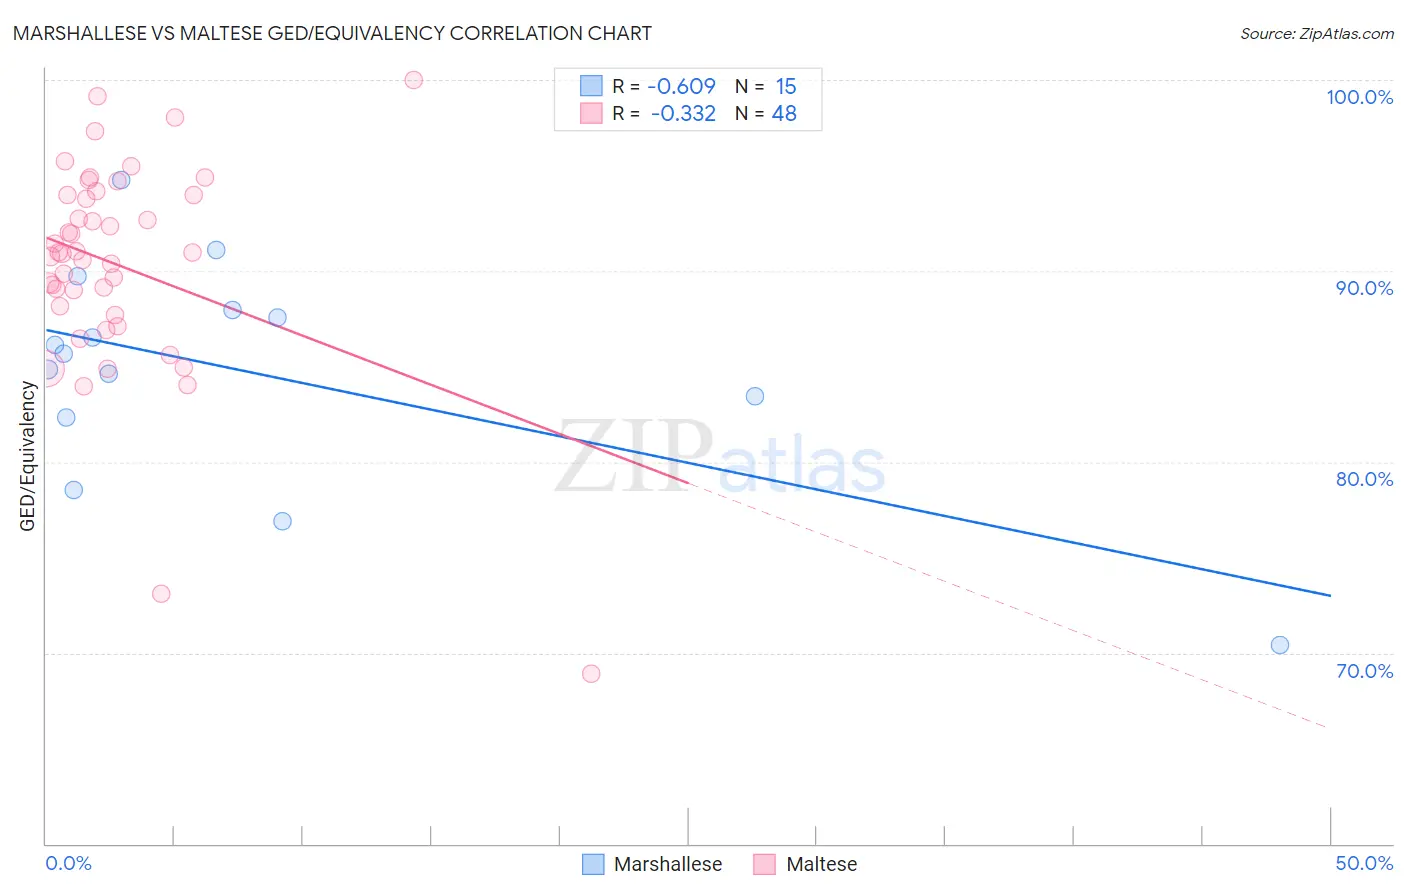
Marshallese vs Maltese GED/Equivalency Correlation Chart
The statistical analysis conducted on geographies consisting of 14,760,991 people shows a significant negative correlation between the proportion of Marshallese and percentage of population with at least ged/equivalency education in the United States with a correlation coefficient (R) of -0.609 and weighted average of 84.9%. Similarly, the statistical analysis conducted on geographies consisting of 126,478,070 people shows a mild negative correlation between the proportion of Maltese and percentage of population with at least ged/equivalency education in the United States with a correlation coefficient (R) of -0.332 and weighted average of 88.6%, a difference of 4.4%.
GED/Equivalency Correlation Summary
| Measurement | Marshallese | Maltese |
| Minimum | 70.4% | 68.9% |
| Maximum | 94.8% | 100.0% |
| Range | 24.4% | 31.1% |
| Mean | 84.7% | 90.3% |
| Median | 85.7% | 90.9% |
| Interquartile 25% (IQ1) | 82.3% | 87.9% |
| Interquartile 75% (IQ3) | 88.0% | 94.0% |
| Interquartile Range (IQR) | 5.6% | 6.0% |
| Standard Deviation (Sample) | 6.0% | 5.7% |
| Standard Deviation (Population) | 5.8% | 5.6% |
Similar Demographics by GED/Equivalency
Demographics Similar to Marshallese by GED/Equivalency
In terms of ged/equivalency, the demographic groups most similar to Marshallese are Colombian (84.9%, a difference of 0.010%), Immigrants from Cameroon (84.9%, a difference of 0.020%), Hmong (84.9%, a difference of 0.030%), Samoan (84.9%, a difference of 0.050%), and South American (84.8%, a difference of 0.080%).
| Demographics | Rating | Rank | GED/Equivalency |
| Portuguese | 15.9 /100 | #201 | Poor 85.0% |
| Cree | 15.9 /100 | #202 | Poor 85.0% |
| Panamanians | 15.3 /100 | #203 | Poor 85.0% |
| Hawaiians | 15.2 /100 | #204 | Poor 85.0% |
| Liberians | 14.6 /100 | #205 | Poor 85.0% |
| Samoans | 13.7 /100 | #206 | Poor 84.9% |
| Hmong | 13.1 /100 | #207 | Poor 84.9% |
| Marshallese | 12.5 /100 | #208 | Poor 84.9% |
| Colombians | 12.3 /100 | #209 | Poor 84.9% |
| Immigrants | Cameroon | 12.1 /100 | #210 | Poor 84.9% |
| South Americans | 10.9 /100 | #211 | Poor 84.8% |
| Immigrants | Somalia | 10.6 /100 | #212 | Poor 84.8% |
| Immigrants | Philippines | 10.0 /100 | #213 | Poor 84.8% |
| Osage | 9.5 /100 | #214 | Tragic 84.8% |
| Peruvians | 9.2 /100 | #215 | Tragic 84.7% |
Demographics Similar to Maltese by GED/Equivalency
In terms of ged/equivalency, the demographic groups most similar to Maltese are Luxembourger (88.6%, a difference of 0.010%), Immigrants from Ireland (88.6%, a difference of 0.020%), Russian (88.6%, a difference of 0.040%), Slovak (88.6%, a difference of 0.040%), and Estonian (88.6%, a difference of 0.040%).
| Demographics | Rating | Rank | GED/Equivalency |
| Immigrants | Iran | 99.9 /100 | #13 | Exceptional 88.9% |
| Cypriots | 99.9 /100 | #14 | Exceptional 88.9% |
| Okinawans | 99.9 /100 | #15 | Exceptional 88.9% |
| Immigrants | Taiwan | 99.9 /100 | #16 | Exceptional 88.8% |
| Croatians | 99.9 /100 | #17 | Exceptional 88.8% |
| Slovenes | 99.9 /100 | #18 | Exceptional 88.8% |
| Swedes | 99.9 /100 | #19 | Exceptional 88.8% |
| Maltese | 99.9 /100 | #20 | Exceptional 88.6% |
| Luxembourgers | 99.8 /100 | #21 | Exceptional 88.6% |
| Immigrants | Ireland | 99.8 /100 | #22 | Exceptional 88.6% |
| Russians | 99.8 /100 | #23 | Exceptional 88.6% |
| Slovaks | 99.8 /100 | #24 | Exceptional 88.6% |
| Estonians | 99.8 /100 | #25 | Exceptional 88.6% |
| Immigrants | Australia | 99.8 /100 | #26 | Exceptional 88.6% |
| Immigrants | Lithuania | 99.8 /100 | #27 | Exceptional 88.6% |