Haitian vs Maltese GED/Equivalency
COMPARE
Haitian
Maltese
GED/Equivalency
GED/Equivalency Comparison
Haitians
Maltese
82.1%
GED/EQUIVALENCY
0.0/ 100
METRIC RATING
290th/ 347
METRIC RANK
88.6%
GED/EQUIVALENCY
99.9/ 100
METRIC RATING
20th/ 347
METRIC RANK
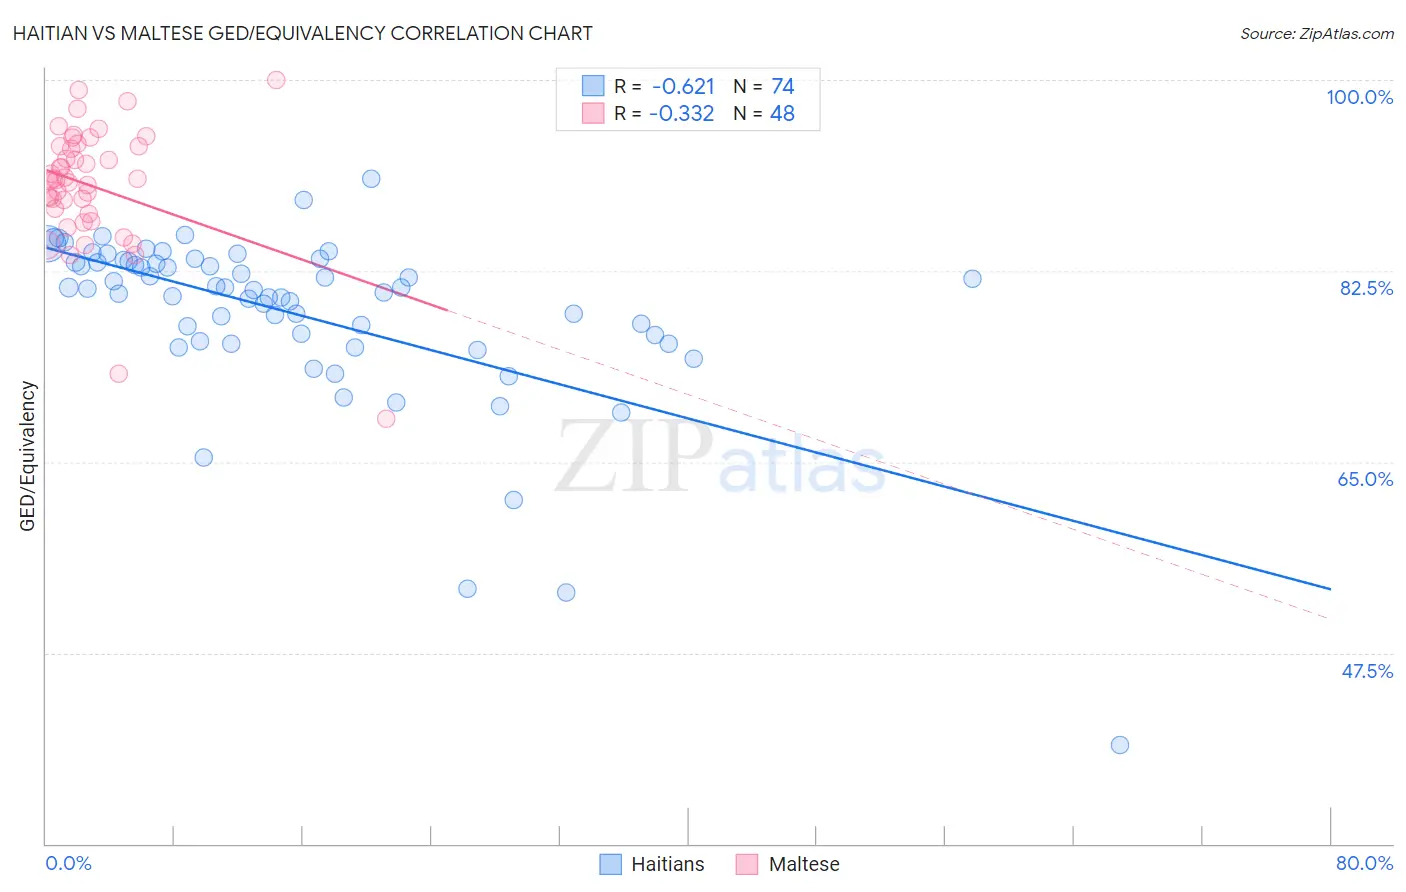
Haitian vs Maltese GED/Equivalency Correlation Chart
The statistical analysis conducted on geographies consisting of 288,018,742 people shows a significant negative correlation between the proportion of Haitians and percentage of population with at least ged/equivalency education in the United States with a correlation coefficient (R) of -0.621 and weighted average of 82.1%. Similarly, the statistical analysis conducted on geographies consisting of 126,478,070 people shows a mild negative correlation between the proportion of Maltese and percentage of population with at least ged/equivalency education in the United States with a correlation coefficient (R) of -0.332 and weighted average of 88.6%, a difference of 8.0%.
GED/Equivalency Correlation Summary
| Measurement | Haitian | Maltese |
| Minimum | 39.0% | 68.9% |
| Maximum | 90.9% | 100.0% |
| Range | 51.9% | 31.1% |
| Mean | 78.6% | 90.3% |
| Median | 80.8% | 90.9% |
| Interquartile 25% (IQ1) | 76.1% | 87.9% |
| Interquartile 75% (IQ3) | 83.3% | 94.0% |
| Interquartile Range (IQR) | 7.2% | 6.0% |
| Standard Deviation (Sample) | 8.2% | 5.7% |
| Standard Deviation (Population) | 8.1% | 5.6% |
Similar Demographics by GED/Equivalency
Demographics Similar to Haitians by GED/Equivalency
In terms of ged/equivalency, the demographic groups most similar to Haitians are Cuban (82.0%, a difference of 0.020%), Paiute (82.0%, a difference of 0.060%), British West Indian (82.0%, a difference of 0.070%), Immigrants from St. Vincent and the Grenadines (82.0%, a difference of 0.090%), and Nepalese (81.9%, a difference of 0.15%).
| Demographics | Rating | Rank | GED/Equivalency |
| Indonesians | 0.1 /100 | #283 | Tragic 82.5% |
| Immigrants | Barbados | 0.1 /100 | #284 | Tragic 82.4% |
| Cajuns | 0.0 /100 | #285 | Tragic 82.4% |
| Immigrants | West Indies | 0.0 /100 | #286 | Tragic 82.4% |
| Japanese | 0.0 /100 | #287 | Tragic 82.4% |
| Pueblo | 0.0 /100 | #288 | Tragic 82.3% |
| Immigrants | Cambodia | 0.0 /100 | #289 | Tragic 82.2% |
| Haitians | 0.0 /100 | #290 | Tragic 82.1% |
| Cubans | 0.0 /100 | #291 | Tragic 82.0% |
| Paiute | 0.0 /100 | #292 | Tragic 82.0% |
| British West Indians | 0.0 /100 | #293 | Tragic 82.0% |
| Immigrants | St. Vincent and the Grenadines | 0.0 /100 | #294 | Tragic 82.0% |
| Nepalese | 0.0 /100 | #295 | Tragic 81.9% |
| Vietnamese | 0.0 /100 | #296 | Tragic 81.9% |
| Immigrants | Bangladesh | 0.0 /100 | #297 | Tragic 81.9% |
Demographics Similar to Maltese by GED/Equivalency
In terms of ged/equivalency, the demographic groups most similar to Maltese are Luxembourger (88.6%, a difference of 0.010%), Immigrants from Ireland (88.6%, a difference of 0.020%), Russian (88.6%, a difference of 0.040%), Slovak (88.6%, a difference of 0.040%), and Estonian (88.6%, a difference of 0.040%).
| Demographics | Rating | Rank | GED/Equivalency |
| Immigrants | Iran | 99.9 /100 | #13 | Exceptional 88.9% |
| Cypriots | 99.9 /100 | #14 | Exceptional 88.9% |
| Okinawans | 99.9 /100 | #15 | Exceptional 88.9% |
| Immigrants | Taiwan | 99.9 /100 | #16 | Exceptional 88.8% |
| Croatians | 99.9 /100 | #17 | Exceptional 88.8% |
| Slovenes | 99.9 /100 | #18 | Exceptional 88.8% |
| Swedes | 99.9 /100 | #19 | Exceptional 88.8% |
| Maltese | 99.9 /100 | #20 | Exceptional 88.6% |
| Luxembourgers | 99.8 /100 | #21 | Exceptional 88.6% |
| Immigrants | Ireland | 99.8 /100 | #22 | Exceptional 88.6% |
| Russians | 99.8 /100 | #23 | Exceptional 88.6% |
| Slovaks | 99.8 /100 | #24 | Exceptional 88.6% |
| Estonians | 99.8 /100 | #25 | Exceptional 88.6% |
| Immigrants | Australia | 99.8 /100 | #26 | Exceptional 88.6% |
| Immigrants | Lithuania | 99.8 /100 | #27 | Exceptional 88.6% |