Marshallese vs Maltese Master's Degree

COMPARE

Marshallese
Race
Ancestry
AfghanAfricanAlaska NativeAlaskan AthabascanAlbanianAleutAlsatianAmericanApacheArabArapahoArgentineanArmenianAssyrian/Chaldean/SyriacAustralianAustrianBahamianBangladeshiBarbadianBasqueBelgianBelizeanBermudanBhutaneseBlackfeetBolivianBrazilianBritishBritish West IndianBulgarianBurmeseCajunCambodianCanadianCape VerdeanCarpatho RusynCelticCentral AmericanCentral American IndianCherokeeCheyenneChickasawChileanChineseChippewaChoctawColombianColvilleComancheCosta RicanCreeCreekCroatianCrowCubanCypriotCzechCzechoslovakianDanishDelawareDominicanDutchDutch West IndianEastern EuropeanEcuadorianEgyptianEnglishEstonianEthiopianEuropeanFijianFilipinoFinnishFrenchFrench American IndianFrench CanadianGermanGerman RussianGhanaianGreekGuamanian/ChamorroGuatemalanGuyaneseHaitianHmongHonduranHopiHoumaHungarianIcelanderIndian (Asian)IndonesianInupiatIranianIraqiIrishIroquoisIsraeliItalianJamaicanJapaneseJordanianKenyanKiowaKoreanLaotianLatvianLebaneseLiberianLithuanianLumbeeLuxembourgerMacedonianMalaysianMarshalleseMenomineeMexicanMexican American IndianMongolianMoroccanNative HawaiianNavajoNepaleseNew ZealanderNicaraguanNigerianNorthern EuropeanNorwegianOkinawanOsageOttawaPaiutePakistaniPalestinianPanamanianParaguayanPennsylvania GermanPeruvianPimaPolishPortuguesePotawatomiPuebloPuerto RicanPuget Sound SalishRomanianRussianSalvadoranSamoanScandinavianScotch-IrishScottishSeminoleSenegaleseSerbianShoshoneSierra LeoneanSiouxSlavicSlovakSloveneSomaliSouth AfricanSouth AmericanSouth American IndianSoviet UnionSpaniardSpanishSpanish AmericanSpanish American IndianSri LankanSubsaharan AfricanSudaneseSwedishSwissSyrianTaiwaneseThaiTlingit-HaidaTohono O'OdhamTonganTrinidadian and TobagonianTsimshianTurkishU.S. Virgin IslanderUgandanUkrainianUruguayanUteVenezuelanVietnameseWelshWest IndianYakamaYaquiYugoslavianYumanYup'ikZimbabwean
Immigration
NonimmigrantsImmigrantsAfghanistanAfricaAlbaniaArgentinaArmeniaAsiaAustraliaAustriaBahamasBangladeshBarbadosBelarusBelgiumBelizeBoliviaBosnia and HerzegovinaBrazilBulgariaBurma/MyanmarCabo VerdeCambodiaCameroonCanadaCaribbeanCentral AmericaChileChinaColombiaCongoCosta RicaCroatiaCubaCzechoslovakiaDenmarkDominicaDominican RepublicEastern AfricaEastern AsiaEastern EuropeEcuadorEgyptEl SalvadorEnglandEritreaEthiopiaEuropeFijiFranceGermanyGhanaGreeceGrenadaGuatemalaGuyanaHaitiHondurasHong KongHungaryIndiaIndonesiaIranIraqIrelandIsraelItalyJamaicaJapanJordanKazakhstanKenyaKoreaKuwaitLaosLatin AmericaLatviaLebanonLiberiaLithuaniaMalaysiaMexicoMicronesiaMiddle AfricaMoldovaMoroccoNepalNetherlandsNicaraguaNigeriaNorth AmericaNorth MacedoniaNorthern AfricaNorthern EuropeNorwayOceaniaPakistanPanamaPeruPhilippinesPolandPortugalRomaniaRussiaSaudi ArabiaScotlandSenegalSerbiaSierra LeoneSingaporeSomaliaSouth AfricaSouth AmericaSouth Central AsiaSouth Eastern AsiaSouthern EuropeSpainSri LankaSt. Vincent and the GrenadinesSudanSwedenSwitzerlandSyriaTaiwanThailandTrinidad and TobagoTurkeyUgandaUkraineUruguayUzbekistanVenezuelaVietnamWest IndiesWestern AfricaWestern AsiaWestern EuropeYemenZaireZimbabweAzores
Maltese
Race
Ancestry
AfghanAfricanAlaska NativeAlaskan AthabascanAlbanianAleutAlsatianAmericanApacheArabArapahoArgentineanArmenianAssyrian/Chaldean/SyriacAustralianAustrianBahamianBangladeshiBarbadianBasqueBelgianBelizeanBermudanBhutaneseBlackfeetBolivianBrazilianBritishBritish West IndianBulgarianBurmeseCajunCambodianCanadianCape VerdeanCarpatho RusynCelticCentral AmericanCentral American IndianCherokeeCheyenneChickasawChileanChineseChippewaChoctawColombianColvilleComancheCosta RicanCreeCreekCroatianCrowCubanCypriotCzechCzechoslovakianDanishDelawareDominicanDutchDutch West IndianEastern EuropeanEcuadorianEgyptianEnglishEstonianEthiopianEuropeanFijianFilipinoFinnishFrenchFrench American IndianFrench CanadianGermanGerman RussianGhanaianGreekGuamanian/ChamorroGuatemalanGuyaneseHaitianHmongHonduranHopiHoumaHungarianIcelanderIndian (Asian)IndonesianInupiatIranianIraqiIrishIroquoisIsraeliItalianJamaicanJapaneseJordanianKenyanKiowaKoreanLaotianLatvianLebaneseLiberianLithuanianLumbeeLuxembourgerMacedonianMalaysianMalteseMenomineeMexicanMexican American IndianMongolianMoroccanNative HawaiianNavajoNepaleseNew ZealanderNicaraguanNigerianNorthern EuropeanNorwegianOkinawanOsageOttawaPaiutePakistaniPalestinianPanamanianParaguayanPennsylvania GermanPeruvianPimaPolishPortuguesePotawatomiPuebloPuerto RicanPuget Sound SalishRomanianRussianSalvadoranSamoanScandinavianScotch-IrishScottishSeminoleSenegaleseSerbianShoshoneSierra LeoneanSiouxSlavicSlovakSloveneSomaliSouth AfricanSouth AmericanSouth American IndianSoviet UnionSpaniardSpanishSpanish AmericanSpanish American IndianSri LankanSubsaharan AfricanSudaneseSwedishSwissSyrianTaiwaneseThaiTlingit-HaidaTohono O'OdhamTonganTrinidadian and TobagonianTsimshianTurkishU.S. Virgin IslanderUgandanUkrainianUruguayanUteVenezuelanVietnameseWelshWest IndianYakamaYaquiYugoslavianYumanYup'ikZimbabwean
Immigration
NonimmigrantsImmigrantsAfghanistanAfricaAlbaniaArgentinaArmeniaAsiaAustraliaAustriaBahamasBangladeshBarbadosBelarusBelgiumBelizeBoliviaBosnia and HerzegovinaBrazilBulgariaBurma/MyanmarCabo VerdeCambodiaCameroonCanadaCaribbeanCentral AmericaChileChinaColombiaCongoCosta RicaCroatiaCubaCzechoslovakiaDenmarkDominicaDominican RepublicEastern AfricaEastern AsiaEastern EuropeEcuadorEgyptEl SalvadorEnglandEritreaEthiopiaEuropeFijiFranceGermanyGhanaGreeceGrenadaGuatemalaGuyanaHaitiHondurasHong KongHungaryIndiaIndonesiaIranIraqIrelandIsraelItalyJamaicaJapanJordanKazakhstanKenyaKoreaKuwaitLaosLatin AmericaLatviaLebanonLiberiaLithuaniaMalaysiaMexicoMicronesiaMiddle AfricaMoldovaMoroccoNepalNetherlandsNicaraguaNigeriaNorth AmericaNorth MacedoniaNorthern AfricaNorthern EuropeNorwayOceaniaPakistanPanamaPeruPhilippinesPolandPortugalRomaniaRussiaSaudi ArabiaScotlandSenegalSerbiaSierra LeoneSingaporeSomaliaSouth AfricaSouth AmericaSouth Central AsiaSouth Eastern AsiaSouthern EuropeSpainSri LankaSt. Vincent and the GrenadinesSudanSwedenSwitzerlandSyriaTaiwanThailandTrinidad and TobagoTurkeyUgandaUkraineUruguayUzbekistanVenezuelaVietnamWest IndiesWestern AfricaWestern AsiaWestern EuropeYemenZaireZimbabweAzores
Master's Degree
Income
Poverty
Unemployment
Labor Participation
Family Structure
Vehicle Availability
Education Level
Disability

Master's Degree Comparison

Marshallese

Maltese

Tragic
Exceptional
11.6%
MASTER'S DEGREE
0.1/ 100
METRIC RATING
295th/ 347
METRIC RANK
17.3%
MASTER'S DEGREE
99.3/ 100
METRIC RATING
87th/ 347
METRIC RANK

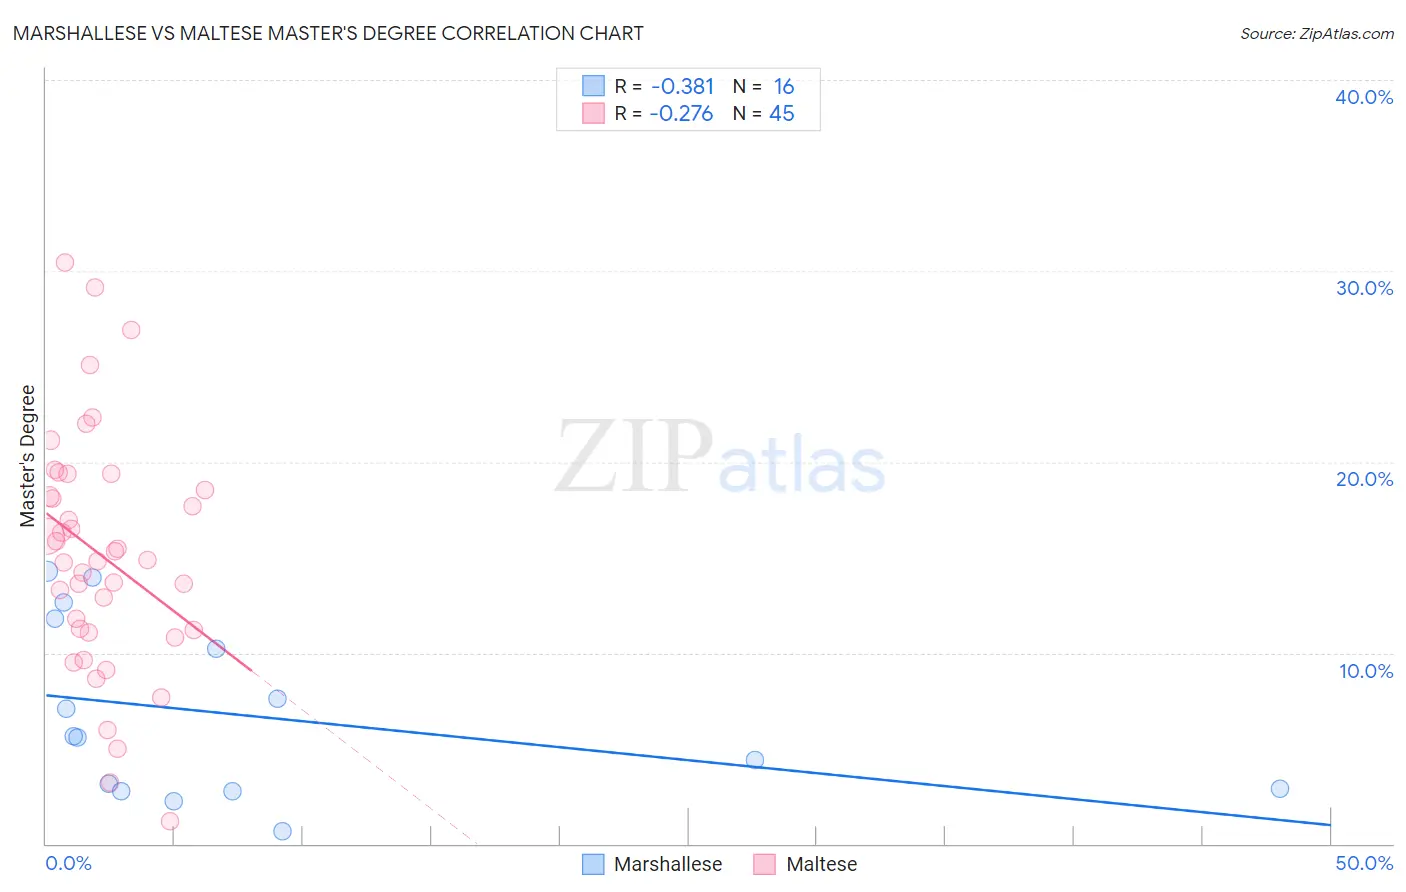
Marshallese vs Maltese Master's Degree Correlation Chart

The statistical analysis conducted on geographies consisting of 14,761,315 people shows a mild negative correlation between the proportion of Marshallese and percentage of population with at least master's degree education in the United States with a correlation coefficient (R) of -0.381 and weighted average of 11.6%. Similarly, the statistical analysis conducted on geographies consisting of 126,460,442 people shows a weak negative correlation between the proportion of Maltese and percentage of population with at least master's degree education in the United States with a correlation coefficient (R) of -0.276 and weighted average of 17.3%, a difference of 49.2%.
Marshallese vs Maltese Master's Degree

Master's Degree Correlation Summary

MeasurementMarshalleseMaltese
Minimum0.68%1.2%
Maximum14.2%30.4%
Range13.6%29.2%
Mean6.7%15.1%
Median5.6%14.8%
Interquartile 25% (IQ1)2.8%11.1%
Interquartile 75% (IQ3)11.0%18.9%
Interquartile Range (IQR)8.2%7.8%
Standard Deviation (Sample)4.5%6.3%
Standard Deviation (Population)4.4%6.2%

Similar Demographics by Master's Degree

Demographics Similar to Marshallese by Master's Degree

In terms of master's degree, the demographic groups most similar to Marshallese are Alaskan Athabascan (11.6%, a difference of 0.010%), Immigrants from Yemen (11.6%, a difference of 0.13%), Hawaiian (11.6%, a difference of 0.15%), Alaska Native (11.6%, a difference of 0.25%), and Immigrants from Guatemala (11.6%, a difference of 0.48%).
DemographicsRating | RankMaster's Degree
Immigrants | Honduras
0.1
/100
|
#288
Tragic
11.8%
Guatemalans
0.1
/100
|
#289
Tragic
11.7%
Ute
0.1
/100
|
#290
Tragic
11.7%
Colville
0.1
/100
|
#291
Tragic
11.6%
Immigrants | Guatemala
0.1
/100
|
#292
Tragic
11.6%
Alaska Natives
0.1
/100
|
#293
Tragic
11.6%
Hawaiians
0.1
/100
|
#294
Tragic
11.6%
Marshallese
0.1
/100
|
#295
Tragic
11.6%
Alaskan Athabascans
0.1
/100
|
#296
Tragic
11.6%
Immigrants | Yemen
0.1
/100
|
#297
Tragic
11.6%
Samoans
0.1
/100
|
#298
Tragic
11.5%
Chickasaw
0.1
/100
|
#299
Tragic
11.4%
Chippewa
0.1
/100
|
#300
Tragic
11.4%
Tsimshian
0.1
/100
|
#301
Tragic
11.4%
Cherokee
0.1
/100
|
#302
Tragic
11.4%

Demographics Similar to Maltese by Master's Degree

In terms of master's degree, the demographic groups most similar to Maltese are Immigrants from Croatia (17.3%, a difference of 0.10%), Immigrants from Canada (17.2%, a difference of 0.36%), Bhutanese (17.2%, a difference of 0.43%), Immigrants from Egypt (17.2%, a difference of 0.45%), and Immigrants from Brazil (17.4%, a difference of 0.51%).
DemographicsRating | RankMaster's Degree
Carpatho Rusyns
99.6
/100
|
#80
Exceptional
17.5%
Immigrants | Western Asia
99.5
/100
|
#81
Exceptional
17.5%
Greeks
99.5
/100
|
#82
Exceptional
17.5%
Immigrants | Zimbabwe
99.5
/100
|
#83
Exceptional
17.4%
Immigrants | Scotland
99.4
/100
|
#84
Exceptional
17.4%
Immigrants | Brazil
99.4
/100
|
#85
Exceptional
17.4%
Immigrants | Croatia
99.3
/100
|
#86
Exceptional
17.3%
Maltese
99.3
/100
|
#87
Exceptional
17.3%
Immigrants | Canada
99.2
/100
|
#88
Exceptional
17.2%
Bhutanese
99.1
/100
|
#89
Exceptional
17.2%
Immigrants | Egypt
99.1
/100
|
#90
Exceptional
17.2%
Romanians
99.1
/100
|
#91
Exceptional
17.2%
Immigrants | North America
99.1
/100
|
#92
Exceptional
17.2%
Immigrants | Italy
99.1
/100
|
#93
Exceptional
17.2%
Ugandans
99.0
/100
|
#94
Exceptional
17.1%