Marshallese vs Maltese Female Disability
COMPARE
Marshallese
Maltese
Female Disability
Female Disability Comparison
Marshallese
Maltese
13.3%
FEMALE DISABILITY
0.0/ 100
METRIC RATING
293rd/ 347
METRIC RANK
12.2%
FEMALE DISABILITY
57.0/ 100
METRIC RATING
170th/ 347
METRIC RANK
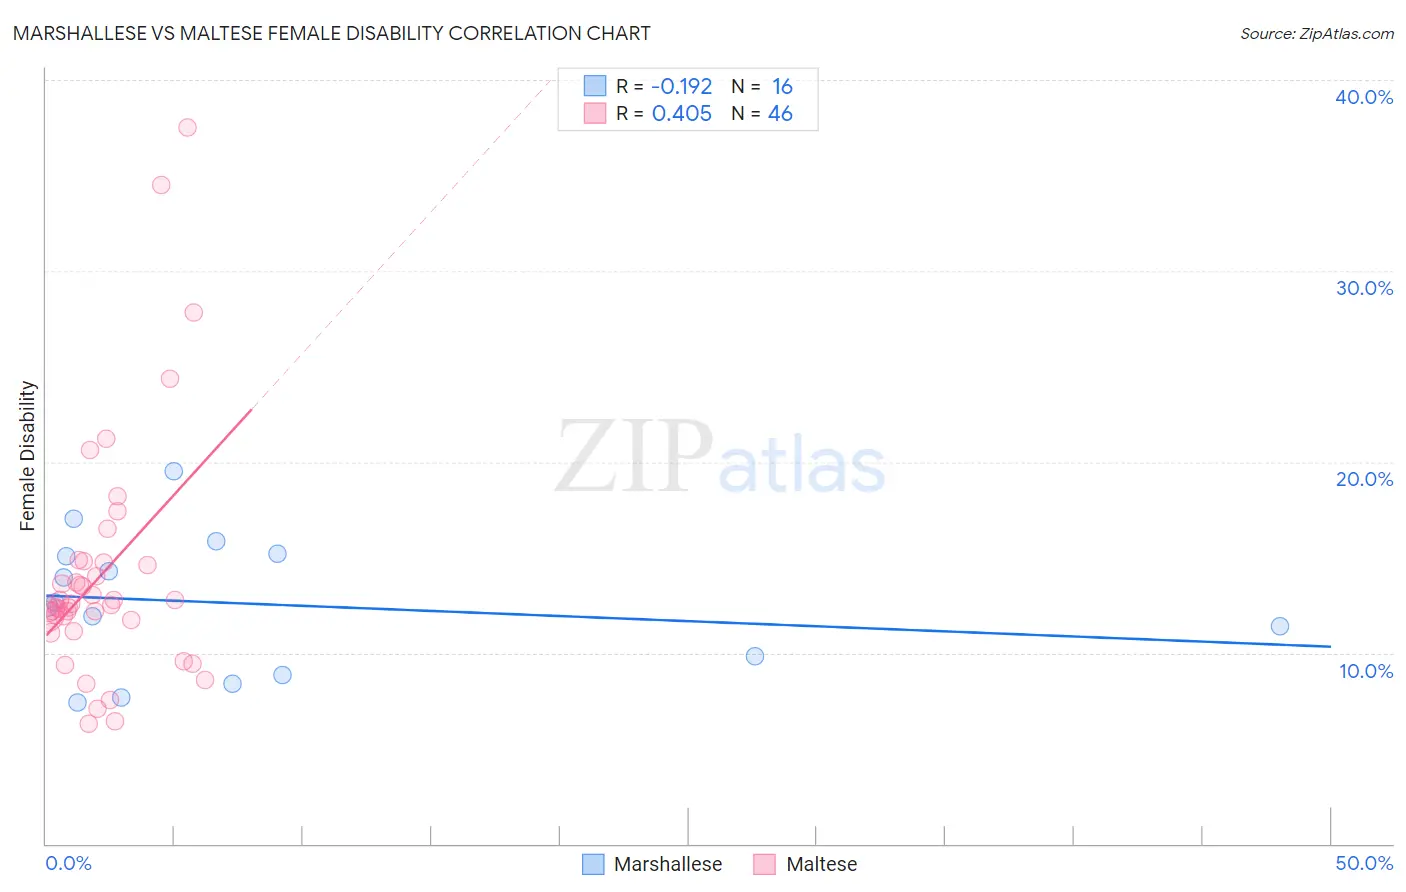
Marshallese vs Maltese Female Disability Correlation Chart
The statistical analysis conducted on geographies consisting of 14,761,315 people shows a poor negative correlation between the proportion of Marshallese and percentage of females with a disability in the United States with a correlation coefficient (R) of -0.192 and weighted average of 13.3%. Similarly, the statistical analysis conducted on geographies consisting of 126,465,818 people shows a moderate positive correlation between the proportion of Maltese and percentage of females with a disability in the United States with a correlation coefficient (R) of 0.405 and weighted average of 12.2%, a difference of 9.1%.
Female Disability Correlation Summary
| Measurement | Marshallese | Maltese |
| Minimum | 7.4% | 6.3% |
| Maximum | 19.5% | 37.5% |
| Range | 12.1% | 31.2% |
| Mean | 12.6% | 14.1% |
| Median | 12.5% | 12.5% |
| Interquartile 25% (IQ1) | 9.3% | 11.7% |
| Interquartile 75% (IQ3) | 15.1% | 14.7% |
| Interquartile Range (IQR) | 5.8% | 3.0% |
| Standard Deviation (Sample) | 3.5% | 6.3% |
| Standard Deviation (Population) | 3.4% | 6.3% |
Similar Demographics by Female Disability
Demographics Similar to Marshallese by Female Disability
In terms of female disability, the demographic groups most similar to Marshallese are Celtic (13.3%, a difference of 0.050%), Yakama (13.2%, a difference of 0.26%), French (13.3%, a difference of 0.26%), Nepalese (13.3%, a difference of 0.39%), and Slovak (13.3%, a difference of 0.42%).
| Demographics | Rating | Rank | Female Disability |
| Fijians | 0.0 /100 | #286 | Tragic 13.1% |
| Yaqui | 0.0 /100 | #287 | Tragic 13.2% |
| Whites/Caucasians | 0.0 /100 | #288 | Tragic 13.2% |
| Tlingit-Haida | 0.0 /100 | #289 | Tragic 13.2% |
| Immigrants | Yemen | 0.0 /100 | #290 | Tragic 13.2% |
| Shoshone | 0.0 /100 | #291 | Tragic 13.2% |
| Yakama | 0.0 /100 | #292 | Tragic 13.2% |
| Marshallese | 0.0 /100 | #293 | Tragic 13.3% |
| Celtics | 0.0 /100 | #294 | Tragic 13.3% |
| French | 0.0 /100 | #295 | Tragic 13.3% |
| Nepalese | 0.0 /100 | #296 | Tragic 13.3% |
| Slovaks | 0.0 /100 | #297 | Tragic 13.3% |
| Immigrants | Nonimmigrants | 0.0 /100 | #298 | Tragic 13.4% |
| Immigrants | Dominican Republic | 0.0 /100 | #299 | Tragic 13.4% |
| Pennsylvania Germans | 0.0 /100 | #300 | Tragic 13.4% |
Demographics Similar to Maltese by Female Disability
In terms of female disability, the demographic groups most similar to Maltese are Immigrants from Southern Europe (12.2%, a difference of 0.030%), Lebanese (12.2%, a difference of 0.040%), Immigrants from Haiti (12.2%, a difference of 0.070%), Immigrants from Latin America (12.2%, a difference of 0.080%), and Lithuanian (12.2%, a difference of 0.10%).
| Demographics | Rating | Rank | Female Disability |
| Guatemalans | 63.8 /100 | #163 | Good 12.1% |
| Czechs | 63.6 /100 | #164 | Good 12.1% |
| Immigrants | Oceania | 61.8 /100 | #165 | Good 12.1% |
| Lithuanians | 59.5 /100 | #166 | Average 12.2% |
| Immigrants | Latin America | 59.0 /100 | #167 | Average 12.2% |
| Immigrants | Haiti | 58.8 /100 | #168 | Average 12.2% |
| Lebanese | 58.1 /100 | #169 | Average 12.2% |
| Maltese | 57.0 /100 | #170 | Average 12.2% |
| Immigrants | Southern Europe | 56.3 /100 | #171 | Average 12.2% |
| Haitians | 51.9 /100 | #172 | Average 12.2% |
| Immigrants | Mexico | 50.8 /100 | #173 | Average 12.2% |
| Immigrants | England | 50.0 /100 | #174 | Average 12.2% |
| Immigrants | St. Vincent and the Grenadines | 49.7 /100 | #175 | Average 12.2% |
| Immigrants | Guyana | 43.1 /100 | #176 | Average 12.2% |
| Immigrants | Ghana | 42.5 /100 | #177 | Average 12.2% |