Maltese vs Chinese Associate's Degree
COMPARE
Maltese
Chinese
Associate's Degree
Associate's Degree Comparison
Maltese
Chinese
50.4%
ASSOCIATE'S DEGREE
99.1/ 100
METRIC RATING
81st/ 347
METRIC RANK
48.5%
ASSOCIATE'S DEGREE
92.5/ 100
METRIC RATING
125th/ 347
METRIC RANK
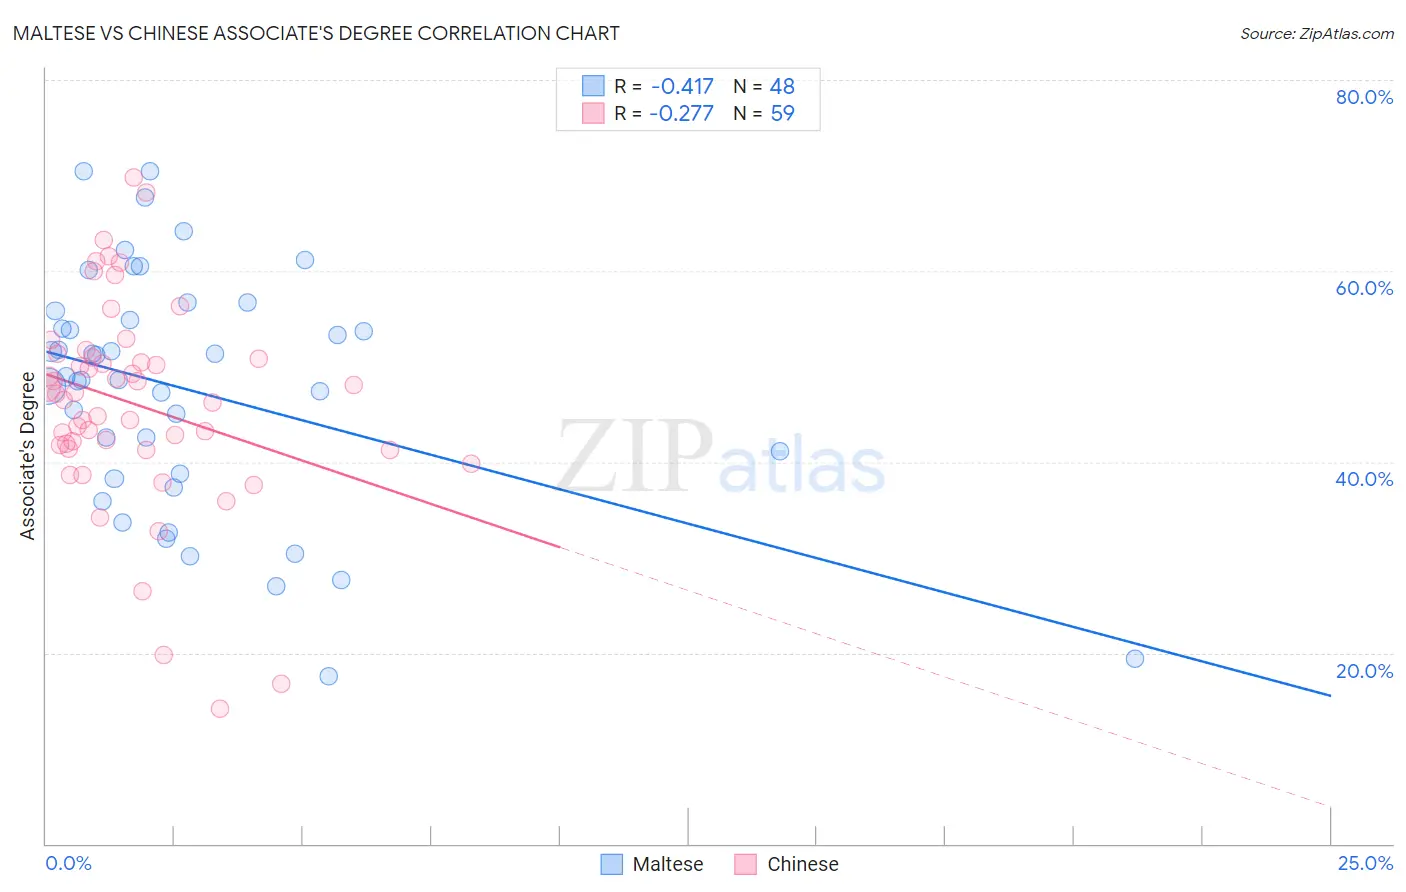
Maltese vs Chinese Associate's Degree Correlation Chart
The statistical analysis conducted on geographies consisting of 126,471,941 people shows a moderate negative correlation between the proportion of Maltese and percentage of population with at least associate's degree education in the United States with a correlation coefficient (R) of -0.417 and weighted average of 50.4%. Similarly, the statistical analysis conducted on geographies consisting of 64,809,883 people shows a weak negative correlation between the proportion of Chinese and percentage of population with at least associate's degree education in the United States with a correlation coefficient (R) of -0.277 and weighted average of 48.5%, a difference of 3.8%.
Associate's Degree Correlation Summary
| Measurement | Maltese | Chinese |
| Minimum | 17.6% | 14.2% |
| Maximum | 70.5% | 69.8% |
| Range | 52.9% | 55.6% |
| Mean | 47.5% | 46.1% |
| Median | 48.7% | 47.1% |
| Interquartile 25% (IQ1) | 38.5% | 41.4% |
| Interquartile 75% (IQ3) | 55.3% | 50.9% |
| Interquartile Range (IQR) | 16.8% | 9.5% |
| Standard Deviation (Sample) | 12.6% | 10.8% |
| Standard Deviation (Population) | 12.5% | 10.7% |
Similar Demographics by Associate's Degree
Demographics Similar to Maltese by Associate's Degree
In terms of associate's degree, the demographic groups most similar to Maltese are Armenian (50.4%, a difference of 0.070%), Ethiopian (50.4%, a difference of 0.10%), Immigrants from Eastern Europe (50.5%, a difference of 0.12%), Immigrants from Lebanon (50.5%, a difference of 0.16%), and Immigrants from Zimbabwe (50.5%, a difference of 0.19%).
| Demographics | Rating | Rank | Associate's Degree |
| Lithuanians | 99.3 /100 | #74 | Exceptional 50.6% |
| Immigrants | Scotland | 99.3 /100 | #75 | Exceptional 50.6% |
| Immigrants | Zimbabwe | 99.2 /100 | #76 | Exceptional 50.5% |
| Immigrants | Lebanon | 99.1 /100 | #77 | Exceptional 50.5% |
| Immigrants | Eastern Europe | 99.1 /100 | #78 | Exceptional 50.5% |
| Ethiopians | 99.1 /100 | #79 | Exceptional 50.4% |
| Armenians | 99.1 /100 | #80 | Exceptional 50.4% |
| Maltese | 99.1 /100 | #81 | Exceptional 50.4% |
| Greeks | 98.9 /100 | #82 | Exceptional 50.3% |
| Immigrants | Uzbekistan | 98.9 /100 | #83 | Exceptional 50.3% |
| Immigrants | Hungary | 98.9 /100 | #84 | Exceptional 50.2% |
| Immigrants | Egypt | 98.9 /100 | #85 | Exceptional 50.2% |
| Immigrants | Croatia | 98.9 /100 | #86 | Exceptional 50.2% |
| Immigrants | Moldova | 98.8 /100 | #87 | Exceptional 50.2% |
| Immigrants | Canada | 98.7 /100 | #88 | Exceptional 50.1% |
Demographics Similar to Chinese by Associate's Degree
In terms of associate's degree, the demographic groups most similar to Chinese are Serbian (48.5%, a difference of 0.020%), Immigrants from Syria (48.5%, a difference of 0.090%), Immigrants from Uganda (48.5%, a difference of 0.10%), Immigrants from Eastern Africa (48.4%, a difference of 0.22%), and Swedish (48.4%, a difference of 0.25%).
| Demographics | Rating | Rank | Associate's Degree |
| Albanians | 94.7 /100 | #118 | Exceptional 48.8% |
| Lebanese | 94.6 /100 | #119 | Exceptional 48.8% |
| Alsatians | 94.6 /100 | #120 | Exceptional 48.8% |
| Ugandans | 93.9 /100 | #121 | Exceptional 48.7% |
| Italians | 93.9 /100 | #122 | Exceptional 48.7% |
| Brazilians | 93.7 /100 | #123 | Exceptional 48.7% |
| Serbians | 92.6 /100 | #124 | Exceptional 48.5% |
| Chinese | 92.5 /100 | #125 | Exceptional 48.5% |
| Immigrants | Syria | 92.2 /100 | #126 | Exceptional 48.5% |
| Immigrants | Uganda | 92.1 /100 | #127 | Exceptional 48.5% |
| Immigrants | Eastern Africa | 91.6 /100 | #128 | Exceptional 48.4% |
| Swedes | 91.5 /100 | #129 | Exceptional 48.4% |
| Immigrants | Jordan | 91.2 /100 | #130 | Exceptional 48.4% |
| Icelanders | 90.8 /100 | #131 | Exceptional 48.3% |
| Immigrants | Albania | 89.9 /100 | #132 | Excellent 48.2% |