Maltese vs Korean Associate's Degree
COMPARE
Maltese
Korean
Associate's Degree
Associate's Degree Comparison
Maltese
Koreans
50.4%
ASSOCIATE'S DEGREE
99.1/ 100
METRIC RATING
81st/ 347
METRIC RANK
45.8%
ASSOCIATE'S DEGREE
33.8/ 100
METRIC RATING
191st/ 347
METRIC RANK
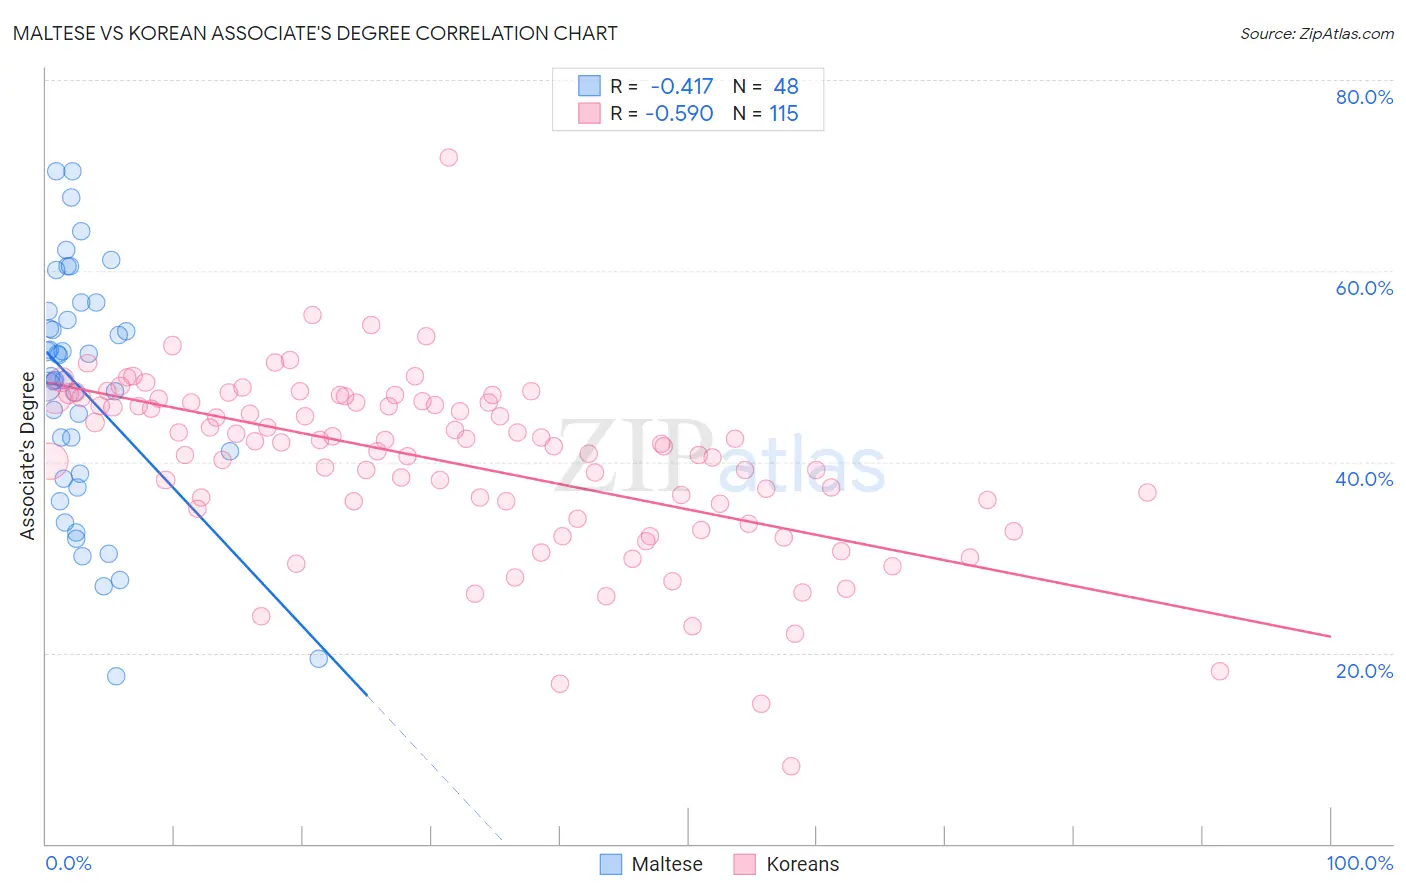
Maltese vs Korean Associate's Degree Correlation Chart
The statistical analysis conducted on geographies consisting of 126,471,941 people shows a moderate negative correlation between the proportion of Maltese and percentage of population with at least associate's degree education in the United States with a correlation coefficient (R) of -0.417 and weighted average of 50.4%. Similarly, the statistical analysis conducted on geographies consisting of 510,898,568 people shows a substantial negative correlation between the proportion of Koreans and percentage of population with at least associate's degree education in the United States with a correlation coefficient (R) of -0.590 and weighted average of 45.8%, a difference of 10.1%.
Associate's Degree Correlation Summary
| Measurement | Maltese | Korean |
| Minimum | 17.6% | 8.1% |
| Maximum | 70.5% | 71.9% |
| Range | 52.9% | 63.8% |
| Mean | 47.5% | 40.0% |
| Median | 48.7% | 42.1% |
| Interquartile 25% (IQ1) | 38.5% | 35.6% |
| Interquartile 75% (IQ3) | 55.3% | 46.3% |
| Interquartile Range (IQR) | 16.8% | 10.7% |
| Standard Deviation (Sample) | 12.6% | 9.2% |
| Standard Deviation (Population) | 12.5% | 9.2% |
Similar Demographics by Associate's Degree
Demographics Similar to Maltese by Associate's Degree
In terms of associate's degree, the demographic groups most similar to Maltese are Armenian (50.4%, a difference of 0.070%), Ethiopian (50.4%, a difference of 0.10%), Immigrants from Eastern Europe (50.5%, a difference of 0.12%), Immigrants from Lebanon (50.5%, a difference of 0.16%), and Immigrants from Zimbabwe (50.5%, a difference of 0.19%).
| Demographics | Rating | Rank | Associate's Degree |
| Lithuanians | 99.3 /100 | #74 | Exceptional 50.6% |
| Immigrants | Scotland | 99.3 /100 | #75 | Exceptional 50.6% |
| Immigrants | Zimbabwe | 99.2 /100 | #76 | Exceptional 50.5% |
| Immigrants | Lebanon | 99.1 /100 | #77 | Exceptional 50.5% |
| Immigrants | Eastern Europe | 99.1 /100 | #78 | Exceptional 50.5% |
| Ethiopians | 99.1 /100 | #79 | Exceptional 50.4% |
| Armenians | 99.1 /100 | #80 | Exceptional 50.4% |
| Maltese | 99.1 /100 | #81 | Exceptional 50.4% |
| Greeks | 98.9 /100 | #82 | Exceptional 50.3% |
| Immigrants | Uzbekistan | 98.9 /100 | #83 | Exceptional 50.3% |
| Immigrants | Hungary | 98.9 /100 | #84 | Exceptional 50.2% |
| Immigrants | Egypt | 98.9 /100 | #85 | Exceptional 50.2% |
| Immigrants | Croatia | 98.9 /100 | #86 | Exceptional 50.2% |
| Immigrants | Moldova | 98.8 /100 | #87 | Exceptional 50.2% |
| Immigrants | Canada | 98.7 /100 | #88 | Exceptional 50.1% |
Demographics Similar to Koreans by Associate's Degree
In terms of associate's degree, the demographic groups most similar to Koreans are Vietnamese (45.8%, a difference of 0.020%), Celtic (45.8%, a difference of 0.050%), Immigrants from Oceania (45.8%, a difference of 0.070%), Ghanaian (45.8%, a difference of 0.13%), and Immigrants from Uruguay (45.8%, a difference of 0.14%).
| Demographics | Rating | Rank | Associate's Degree |
| Czechoslovakians | 40.0 /100 | #184 | Average 46.0% |
| Costa Ricans | 38.6 /100 | #185 | Fair 46.0% |
| Welsh | 37.9 /100 | #186 | Fair 45.9% |
| Immigrants | Uruguay | 35.5 /100 | #187 | Fair 45.8% |
| Ghanaians | 35.5 /100 | #188 | Fair 45.8% |
| Immigrants | Oceania | 34.7 /100 | #189 | Fair 45.8% |
| Vietnamese | 34.0 /100 | #190 | Fair 45.8% |
| Koreans | 33.8 /100 | #191 | Fair 45.8% |
| Celtics | 33.3 /100 | #192 | Fair 45.8% |
| Immigrants | Cameroon | 31.0 /100 | #193 | Fair 45.7% |
| Immigrants | Peru | 27.6 /100 | #194 | Fair 45.5% |
| Germans | 26.5 /100 | #195 | Fair 45.5% |
| French | 25.6 /100 | #196 | Fair 45.4% |
| Scotch-Irish | 22.3 /100 | #197 | Fair 45.3% |
| Immigrants | Bangladesh | 21.3 /100 | #198 | Fair 45.2% |