Maltese vs Pueblo Associate's Degree
COMPARE
Maltese
Pueblo
Associate's Degree
Associate's Degree Comparison
Maltese
Pueblo
50.4%
ASSOCIATE'S DEGREE
99.1/ 100
METRIC RATING
81st/ 347
METRIC RANK
34.0%
ASSOCIATE'S DEGREE
0.0/ 100
METRIC RATING
338th/ 347
METRIC RANK
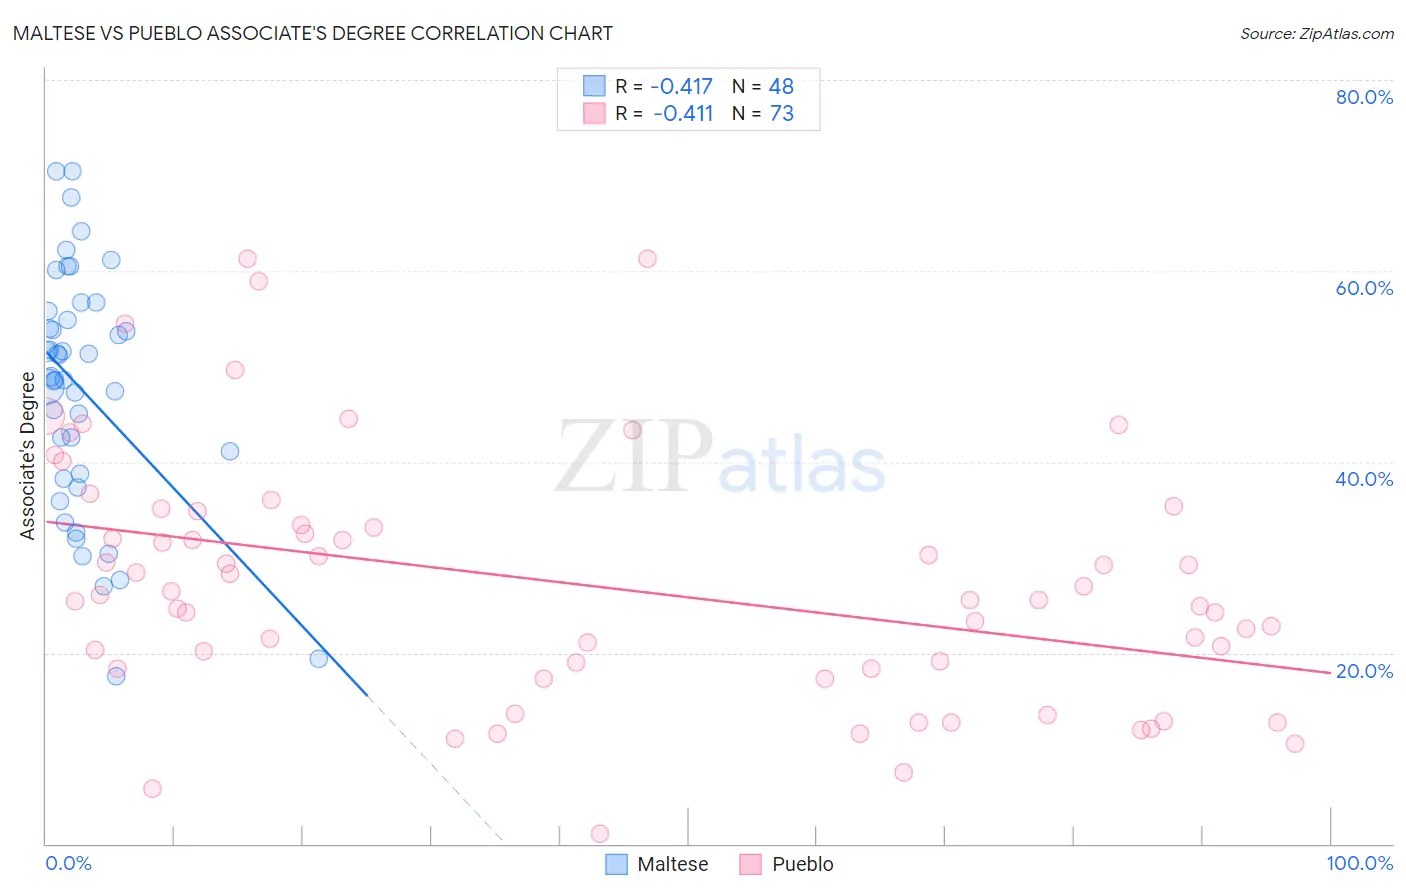
Maltese vs Pueblo Associate's Degree Correlation Chart
The statistical analysis conducted on geographies consisting of 126,471,941 people shows a moderate negative correlation between the proportion of Maltese and percentage of population with at least associate's degree education in the United States with a correlation coefficient (R) of -0.417 and weighted average of 50.4%. Similarly, the statistical analysis conducted on geographies consisting of 120,085,787 people shows a moderate negative correlation between the proportion of Pueblo and percentage of population with at least associate's degree education in the United States with a correlation coefficient (R) of -0.411 and weighted average of 34.0%, a difference of 48.3%.
Associate's Degree Correlation Summary
| Measurement | Maltese | Pueblo |
| Minimum | 17.6% | 1.1% |
| Maximum | 70.5% | 61.3% |
| Range | 52.9% | 60.3% |
| Mean | 47.5% | 27.2% |
| Median | 48.7% | 25.6% |
| Interquartile 25% (IQ1) | 38.5% | 18.3% |
| Interquartile 75% (IQ3) | 55.3% | 34.1% |
| Interquartile Range (IQR) | 16.8% | 15.8% |
| Standard Deviation (Sample) | 12.6% | 13.0% |
| Standard Deviation (Population) | 12.5% | 13.0% |
Similar Demographics by Associate's Degree
Demographics Similar to Maltese by Associate's Degree
In terms of associate's degree, the demographic groups most similar to Maltese are Armenian (50.4%, a difference of 0.070%), Ethiopian (50.4%, a difference of 0.10%), Immigrants from Eastern Europe (50.5%, a difference of 0.12%), Immigrants from Lebanon (50.5%, a difference of 0.16%), and Immigrants from Zimbabwe (50.5%, a difference of 0.19%).
| Demographics | Rating | Rank | Associate's Degree |
| Lithuanians | 99.3 /100 | #74 | Exceptional 50.6% |
| Immigrants | Scotland | 99.3 /100 | #75 | Exceptional 50.6% |
| Immigrants | Zimbabwe | 99.2 /100 | #76 | Exceptional 50.5% |
| Immigrants | Lebanon | 99.1 /100 | #77 | Exceptional 50.5% |
| Immigrants | Eastern Europe | 99.1 /100 | #78 | Exceptional 50.5% |
| Ethiopians | 99.1 /100 | #79 | Exceptional 50.4% |
| Armenians | 99.1 /100 | #80 | Exceptional 50.4% |
| Maltese | 99.1 /100 | #81 | Exceptional 50.4% |
| Greeks | 98.9 /100 | #82 | Exceptional 50.3% |
| Immigrants | Uzbekistan | 98.9 /100 | #83 | Exceptional 50.3% |
| Immigrants | Hungary | 98.9 /100 | #84 | Exceptional 50.2% |
| Immigrants | Egypt | 98.9 /100 | #85 | Exceptional 50.2% |
| Immigrants | Croatia | 98.9 /100 | #86 | Exceptional 50.2% |
| Immigrants | Moldova | 98.8 /100 | #87 | Exceptional 50.2% |
| Immigrants | Canada | 98.7 /100 | #88 | Exceptional 50.1% |
Demographics Similar to Pueblo by Associate's Degree
In terms of associate's degree, the demographic groups most similar to Pueblo are Lumbee (34.1%, a difference of 0.41%), Immigrants from Mexico (33.7%, a difference of 0.71%), Hopi (34.6%, a difference of 1.7%), Spanish American Indian (34.9%, a difference of 2.6%), and Native/Alaskan (34.9%, a difference of 2.8%).
| Demographics | Rating | Rank | Associate's Degree |
| Immigrants | Azores | 0.0 /100 | #331 | Tragic 35.6% |
| Immigrants | Central America | 0.0 /100 | #332 | Tragic 35.0% |
| Mexicans | 0.0 /100 | #333 | Tragic 35.0% |
| Natives/Alaskans | 0.0 /100 | #334 | Tragic 34.9% |
| Spanish American Indians | 0.0 /100 | #335 | Tragic 34.9% |
| Hopi | 0.0 /100 | #336 | Tragic 34.6% |
| Lumbee | 0.0 /100 | #337 | Tragic 34.1% |
| Pueblo | 0.0 /100 | #338 | Tragic 34.0% |
| Immigrants | Mexico | 0.0 /100 | #339 | Tragic 33.7% |
| Navajo | 0.0 /100 | #340 | Tragic 32.6% |
| Inupiat | 0.0 /100 | #341 | Tragic 32.6% |
| Yakama | 0.0 /100 | #342 | Tragic 32.3% |
| Tohono O'odham | 0.0 /100 | #343 | Tragic 31.8% |
| Yuman | 0.0 /100 | #344 | Tragic 31.3% |
| Pima | 0.0 /100 | #345 | Tragic 30.2% |