Malaysian vs Immigrants from Liberia Associate's Degree
COMPARE
Malaysian
Immigrants from Liberia
Associate's Degree
Associate's Degree Comparison
Malaysians
Immigrants from Liberia
41.6%
ASSOCIATE'S DEGREE
0.4/ 100
METRIC RATING
259th/ 347
METRIC RANK
42.3%
ASSOCIATE'S DEGREE
0.9/ 100
METRIC RATING
244th/ 347
METRIC RANK
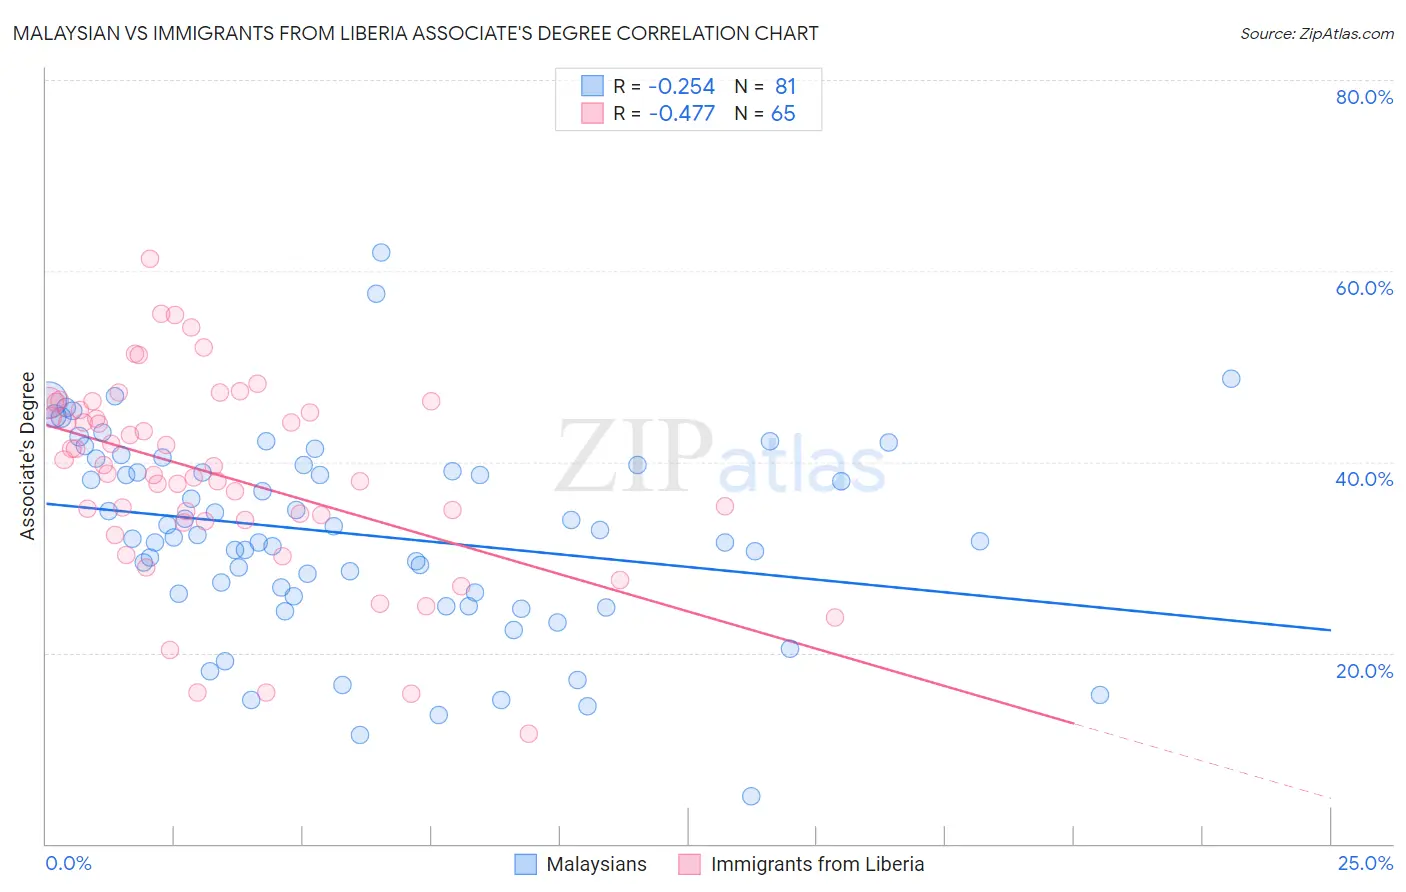
Malaysian vs Immigrants from Liberia Associate's Degree Correlation Chart
The statistical analysis conducted on geographies consisting of 226,101,912 people shows a weak negative correlation between the proportion of Malaysians and percentage of population with at least associate's degree education in the United States with a correlation coefficient (R) of -0.254 and weighted average of 41.6%. Similarly, the statistical analysis conducted on geographies consisting of 135,295,697 people shows a moderate negative correlation between the proportion of Immigrants from Liberia and percentage of population with at least associate's degree education in the United States with a correlation coefficient (R) of -0.477 and weighted average of 42.3%, a difference of 1.5%.
Associate's Degree Correlation Summary
| Measurement | Malaysian | Immigrants from Liberia |
| Minimum | 5.0% | 11.5% |
| Maximum | 62.0% | 61.3% |
| Range | 57.0% | 49.8% |
| Mean | 32.4% | 38.6% |
| Median | 32.1% | 39.5% |
| Interquartile 25% (IQ1) | 26.1% | 33.9% |
| Interquartile 75% (IQ3) | 39.7% | 45.8% |
| Interquartile Range (IQR) | 13.6% | 12.0% |
| Standard Deviation (Sample) | 10.4% | 10.2% |
| Standard Deviation (Population) | 10.4% | 10.2% |
Demographics Similar to Malaysians and Immigrants from Liberia by Associate's Degree
In terms of associate's degree, the demographic groups most similar to Malaysians are Japanese (41.7%, a difference of 0.10%), Marshallese (41.6%, a difference of 0.19%), Spanish American (41.8%, a difference of 0.32%), Nicaraguan (41.5%, a difference of 0.32%), and Immigrants from Congo (41.8%, a difference of 0.38%). Similarly, the demographic groups most similar to Immigrants from Liberia are Immigrants from Cambodia (42.3%, a difference of 0.020%), Delaware (42.3%, a difference of 0.050%), Guyanese (42.3%, a difference of 0.14%), Immigrants from Fiji (42.2%, a difference of 0.14%), and Immigrants from Ecuador (42.2%, a difference of 0.23%).
| Demographics | Rating | Rank | Associate's Degree |
| British West Indians | 1.0 /100 | #241 | Tragic 42.4% |
| Immigrants | West Indies | 1.0 /100 | #242 | Tragic 42.4% |
| Guyanese | 1.0 /100 | #243 | Tragic 42.3% |
| Immigrants | Liberia | 0.9 /100 | #244 | Tragic 42.3% |
| Immigrants | Cambodia | 0.9 /100 | #245 | Tragic 42.3% |
| Delaware | 0.9 /100 | #246 | Tragic 42.3% |
| Immigrants | Fiji | 0.8 /100 | #247 | Tragic 42.2% |
| Immigrants | Ecuador | 0.8 /100 | #248 | Tragic 42.2% |
| Jamaicans | 0.7 /100 | #249 | Tragic 42.1% |
| U.S. Virgin Islanders | 0.7 /100 | #250 | Tragic 42.1% |
| Immigrants | Bahamas | 0.7 /100 | #251 | Tragic 42.1% |
| French American Indians | 0.6 /100 | #252 | Tragic 42.0% |
| Indonesians | 0.6 /100 | #253 | Tragic 41.9% |
| Cubans | 0.6 /100 | #254 | Tragic 41.9% |
| Immigrants | Guyana | 0.5 /100 | #255 | Tragic 41.8% |
| Immigrants | Congo | 0.5 /100 | #256 | Tragic 41.8% |
| Spanish Americans | 0.5 /100 | #257 | Tragic 41.8% |
| Japanese | 0.5 /100 | #258 | Tragic 41.7% |
| Malaysians | 0.4 /100 | #259 | Tragic 41.6% |
| Marshallese | 0.4 /100 | #260 | Tragic 41.6% |
| Nicaraguans | 0.4 /100 | #261 | Tragic 41.5% |