Malaysian vs Northern European Associate's Degree
COMPARE
Malaysian
Northern European
Associate's Degree
Associate's Degree Comparison
Malaysians
Northern Europeans
41.6%
ASSOCIATE'S DEGREE
0.4/ 100
METRIC RATING
259th/ 347
METRIC RANK
49.5%
ASSOCIATE'S DEGREE
97.3/ 100
METRIC RATING
101st/ 347
METRIC RANK
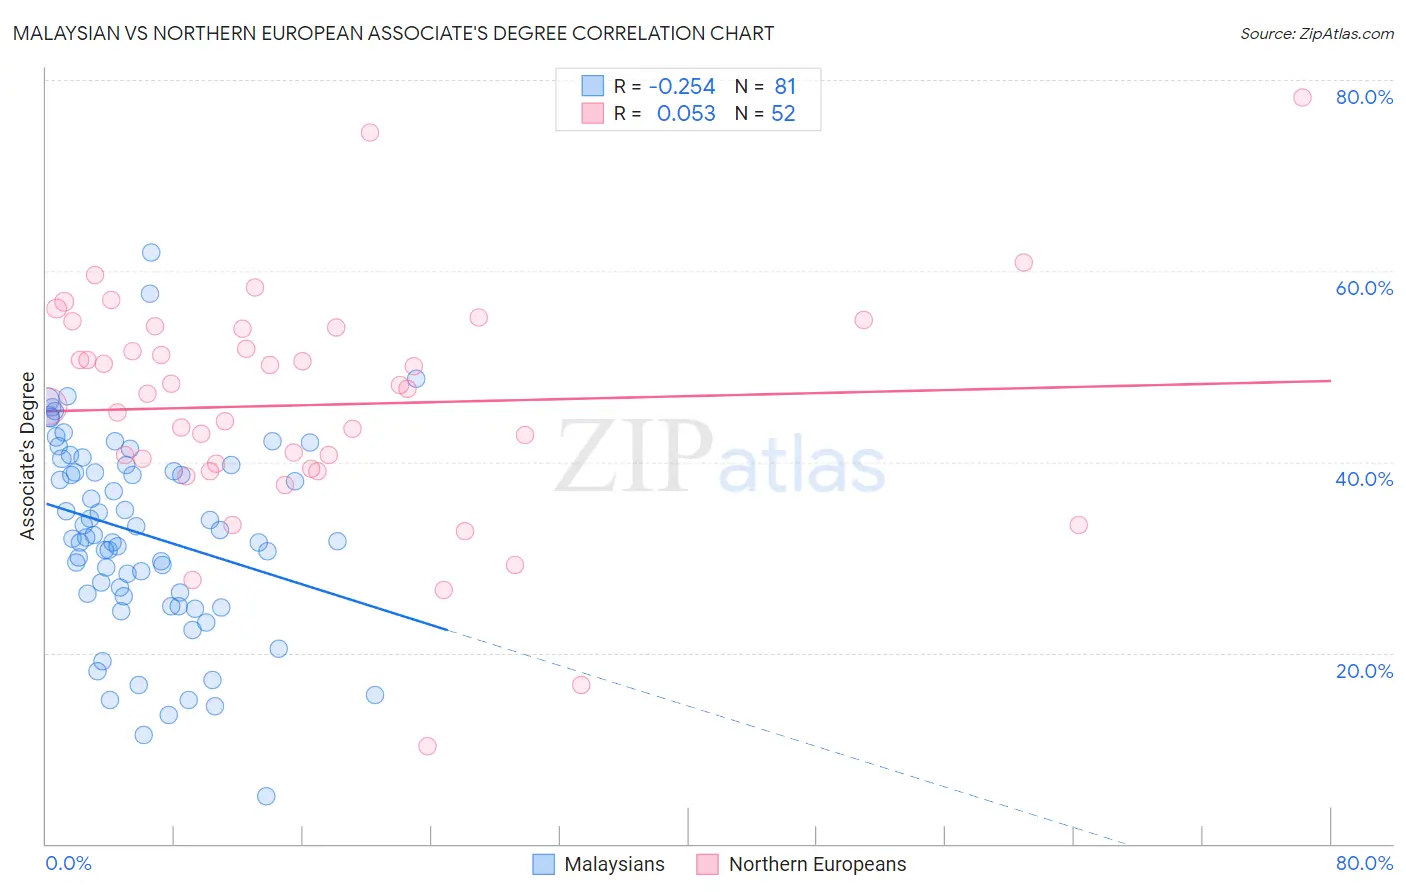
Malaysian vs Northern European Associate's Degree Correlation Chart
The statistical analysis conducted on geographies consisting of 226,101,912 people shows a weak negative correlation between the proportion of Malaysians and percentage of population with at least associate's degree education in the United States with a correlation coefficient (R) of -0.254 and weighted average of 41.6%. Similarly, the statistical analysis conducted on geographies consisting of 406,085,887 people shows a slight positive correlation between the proportion of Northern Europeans and percentage of population with at least associate's degree education in the United States with a correlation coefficient (R) of 0.053 and weighted average of 49.5%, a difference of 18.8%.
Associate's Degree Correlation Summary
| Measurement | Malaysian | Northern European |
| Minimum | 5.0% | 10.2% |
| Maximum | 62.0% | 78.2% |
| Range | 57.0% | 68.0% |
| Mean | 32.4% | 46.0% |
| Median | 32.1% | 47.4% |
| Interquartile 25% (IQ1) | 26.1% | 39.6% |
| Interquartile 75% (IQ3) | 39.7% | 54.0% |
| Interquartile Range (IQR) | 13.6% | 14.4% |
| Standard Deviation (Sample) | 10.4% | 12.1% |
| Standard Deviation (Population) | 10.4% | 12.0% |
Similar Demographics by Associate's Degree
Demographics Similar to Malaysians by Associate's Degree
In terms of associate's degree, the demographic groups most similar to Malaysians are Japanese (41.7%, a difference of 0.10%), Marshallese (41.6%, a difference of 0.19%), Spanish American (41.8%, a difference of 0.32%), Nicaraguan (41.5%, a difference of 0.32%), and Immigrants from Congo (41.8%, a difference of 0.38%).
| Demographics | Rating | Rank | Associate's Degree |
| French American Indians | 0.6 /100 | #252 | Tragic 42.0% |
| Indonesians | 0.6 /100 | #253 | Tragic 41.9% |
| Cubans | 0.6 /100 | #254 | Tragic 41.9% |
| Immigrants | Guyana | 0.5 /100 | #255 | Tragic 41.8% |
| Immigrants | Congo | 0.5 /100 | #256 | Tragic 41.8% |
| Spanish Americans | 0.5 /100 | #257 | Tragic 41.8% |
| Japanese | 0.5 /100 | #258 | Tragic 41.7% |
| Malaysians | 0.4 /100 | #259 | Tragic 41.6% |
| Marshallese | 0.4 /100 | #260 | Tragic 41.6% |
| Nicaraguans | 0.4 /100 | #261 | Tragic 41.5% |
| Bahamians | 0.4 /100 | #262 | Tragic 41.5% |
| Immigrants | Jamaica | 0.3 /100 | #263 | Tragic 41.5% |
| Osage | 0.3 /100 | #264 | Tragic 41.5% |
| Africans | 0.2 /100 | #265 | Tragic 41.1% |
| Samoans | 0.2 /100 | #266 | Tragic 41.1% |
Demographics Similar to Northern Europeans by Associate's Degree
In terms of associate's degree, the demographic groups most similar to Northern Europeans are Chilean (49.4%, a difference of 0.030%), Ukrainian (49.4%, a difference of 0.13%), Immigrants from Nepal (49.5%, a difference of 0.16%), Venezuelan (49.4%, a difference of 0.20%), and Croatian (49.3%, a difference of 0.34%).
| Demographics | Rating | Rank | Associate's Degree |
| Laotians | 98.4 /100 | #94 | Exceptional 49.9% |
| Immigrants | England | 98.0 /100 | #95 | Exceptional 49.7% |
| Romanians | 98.0 /100 | #96 | Exceptional 49.7% |
| Immigrants | Ukraine | 98.0 /100 | #97 | Exceptional 49.7% |
| Immigrants | Northern Africa | 97.9 /100 | #98 | Exceptional 49.7% |
| Macedonians | 97.8 /100 | #99 | Exceptional 49.6% |
| Immigrants | Nepal | 97.5 /100 | #100 | Exceptional 49.5% |
| Northern Europeans | 97.3 /100 | #101 | Exceptional 49.5% |
| Chileans | 97.3 /100 | #102 | Exceptional 49.4% |
| Ukrainians | 97.1 /100 | #103 | Exceptional 49.4% |
| Venezuelans | 97.0 /100 | #104 | Exceptional 49.4% |
| Croatians | 96.8 /100 | #105 | Exceptional 49.3% |
| Immigrants | Italy | 96.7 /100 | #106 | Exceptional 49.3% |
| Syrians | 96.7 /100 | #107 | Exceptional 49.3% |
| Jordanians | 96.6 /100 | #108 | Exceptional 49.2% |