Malaysian vs New Zealander Associate's Degree
COMPARE
Malaysian
New Zealander
Associate's Degree
Associate's Degree Comparison
Malaysians
New Zealanders
41.6%
ASSOCIATE'S DEGREE
0.4/ 100
METRIC RATING
259th/ 347
METRIC RANK
51.8%
ASSOCIATE'S DEGREE
99.8/ 100
METRIC RATING
58th/ 347
METRIC RANK
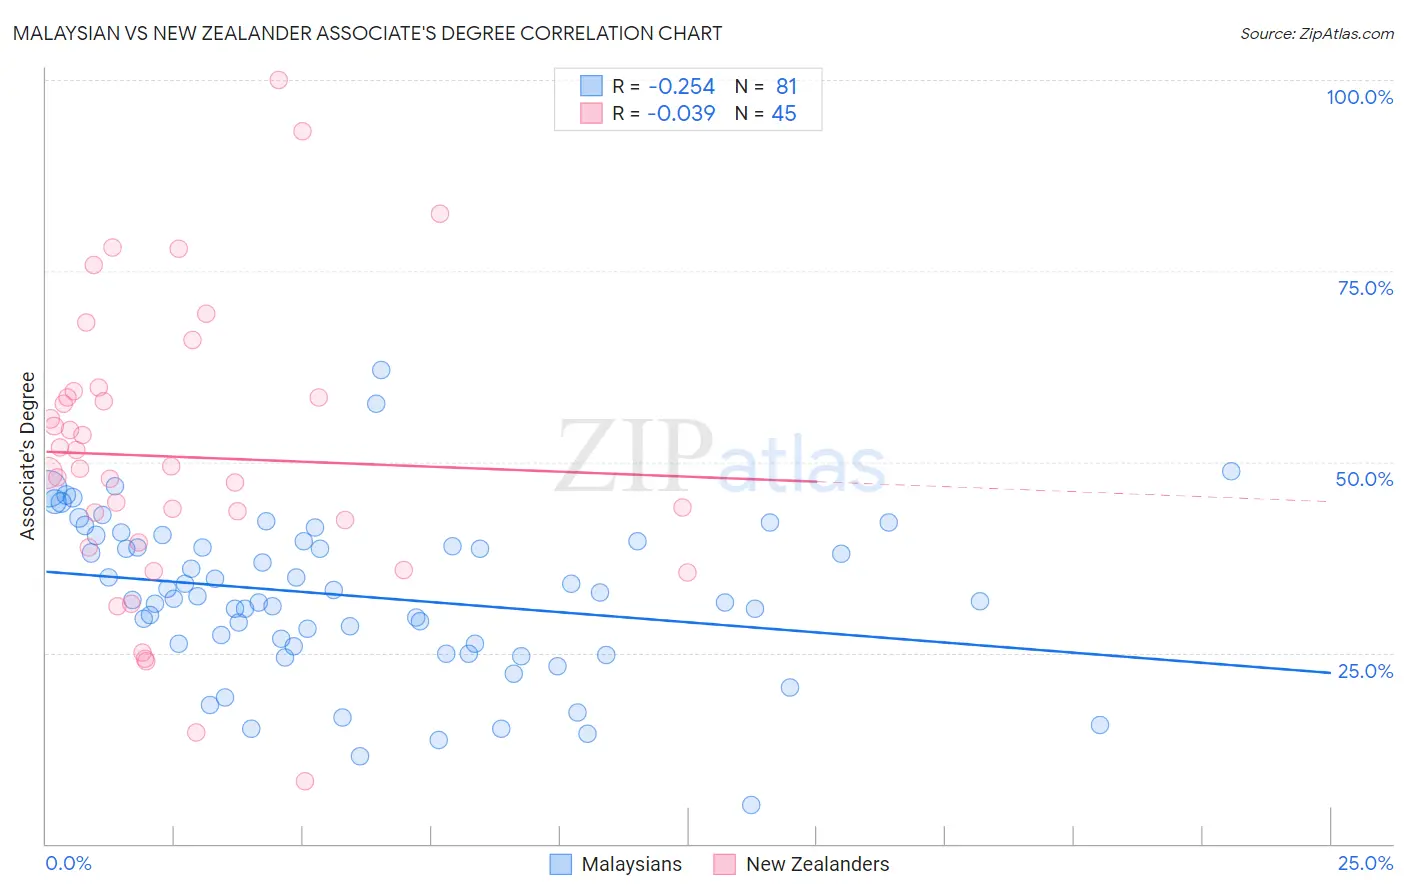
Malaysian vs New Zealander Associate's Degree Correlation Chart
The statistical analysis conducted on geographies consisting of 226,101,912 people shows a weak negative correlation between the proportion of Malaysians and percentage of population with at least associate's degree education in the United States with a correlation coefficient (R) of -0.254 and weighted average of 41.6%. Similarly, the statistical analysis conducted on geographies consisting of 106,916,688 people shows no correlation between the proportion of New Zealanders and percentage of population with at least associate's degree education in the United States with a correlation coefficient (R) of -0.039 and weighted average of 51.8%, a difference of 24.4%.
Associate's Degree Correlation Summary
| Measurement | Malaysian | New Zealander |
| Minimum | 5.0% | 8.2% |
| Maximum | 62.0% | 100.0% |
| Range | 57.0% | 91.8% |
| Mean | 32.4% | 50.7% |
| Median | 32.1% | 49.1% |
| Interquartile 25% (IQ1) | 26.1% | 39.1% |
| Interquartile 75% (IQ3) | 39.7% | 58.9% |
| Interquartile Range (IQR) | 13.6% | 19.8% |
| Standard Deviation (Sample) | 10.4% | 19.0% |
| Standard Deviation (Population) | 10.4% | 18.8% |
Similar Demographics by Associate's Degree
Demographics Similar to Malaysians by Associate's Degree
In terms of associate's degree, the demographic groups most similar to Malaysians are Japanese (41.7%, a difference of 0.10%), Marshallese (41.6%, a difference of 0.19%), Spanish American (41.8%, a difference of 0.32%), Nicaraguan (41.5%, a difference of 0.32%), and Immigrants from Congo (41.8%, a difference of 0.38%).
| Demographics | Rating | Rank | Associate's Degree |
| French American Indians | 0.6 /100 | #252 | Tragic 42.0% |
| Indonesians | 0.6 /100 | #253 | Tragic 41.9% |
| Cubans | 0.6 /100 | #254 | Tragic 41.9% |
| Immigrants | Guyana | 0.5 /100 | #255 | Tragic 41.8% |
| Immigrants | Congo | 0.5 /100 | #256 | Tragic 41.8% |
| Spanish Americans | 0.5 /100 | #257 | Tragic 41.8% |
| Japanese | 0.5 /100 | #258 | Tragic 41.7% |
| Malaysians | 0.4 /100 | #259 | Tragic 41.6% |
| Marshallese | 0.4 /100 | #260 | Tragic 41.6% |
| Nicaraguans | 0.4 /100 | #261 | Tragic 41.5% |
| Bahamians | 0.4 /100 | #262 | Tragic 41.5% |
| Immigrants | Jamaica | 0.3 /100 | #263 | Tragic 41.5% |
| Osage | 0.3 /100 | #264 | Tragic 41.5% |
| Africans | 0.2 /100 | #265 | Tragic 41.1% |
| Samoans | 0.2 /100 | #266 | Tragic 41.1% |
Demographics Similar to New Zealanders by Associate's Degree
In terms of associate's degree, the demographic groups most similar to New Zealanders are Paraguayan (51.8%, a difference of 0.030%), Immigrants from Serbia (51.7%, a difference of 0.13%), Immigrants from Czechoslovakia (51.9%, a difference of 0.15%), Australian (51.9%, a difference of 0.17%), and Immigrants from Spain (51.9%, a difference of 0.20%).
| Demographics | Rating | Rank | Associate's Degree |
| Immigrants | Greece | 99.9 /100 | #51 | Exceptional 52.1% |
| Bolivians | 99.8 /100 | #52 | Exceptional 52.0% |
| Immigrants | Asia | 99.8 /100 | #53 | Exceptional 52.0% |
| Immigrants | Spain | 99.8 /100 | #54 | Exceptional 51.9% |
| Australians | 99.8 /100 | #55 | Exceptional 51.9% |
| Immigrants | Czechoslovakia | 99.8 /100 | #56 | Exceptional 51.9% |
| Paraguayans | 99.8 /100 | #57 | Exceptional 51.8% |
| New Zealanders | 99.8 /100 | #58 | Exceptional 51.8% |
| Immigrants | Serbia | 99.8 /100 | #59 | Exceptional 51.7% |
| Immigrants | Bolivia | 99.7 /100 | #60 | Exceptional 51.5% |
| Immigrants | Kazakhstan | 99.7 /100 | #61 | Exceptional 51.4% |
| Bhutanese | 99.7 /100 | #62 | Exceptional 51.4% |
| South Africans | 99.7 /100 | #63 | Exceptional 51.4% |
| Immigrants | Netherlands | 99.7 /100 | #64 | Exceptional 51.4% |
| Zimbabweans | 99.7 /100 | #65 | Exceptional 51.3% |