Malaysian vs Guamanian/Chamorro Currently Married
COMPARE
Malaysian
Guamanian/Chamorro
Currently Married
Currently Married Comparison
Malaysians
Guamanians/Chamorros
45.9%
CURRENTLY MARRIED
15.3/ 100
METRIC RATING
201st/ 347
METRIC RANK
47.1%
CURRENTLY MARRIED
74.2/ 100
METRIC RATING
143rd/ 347
METRIC RANK
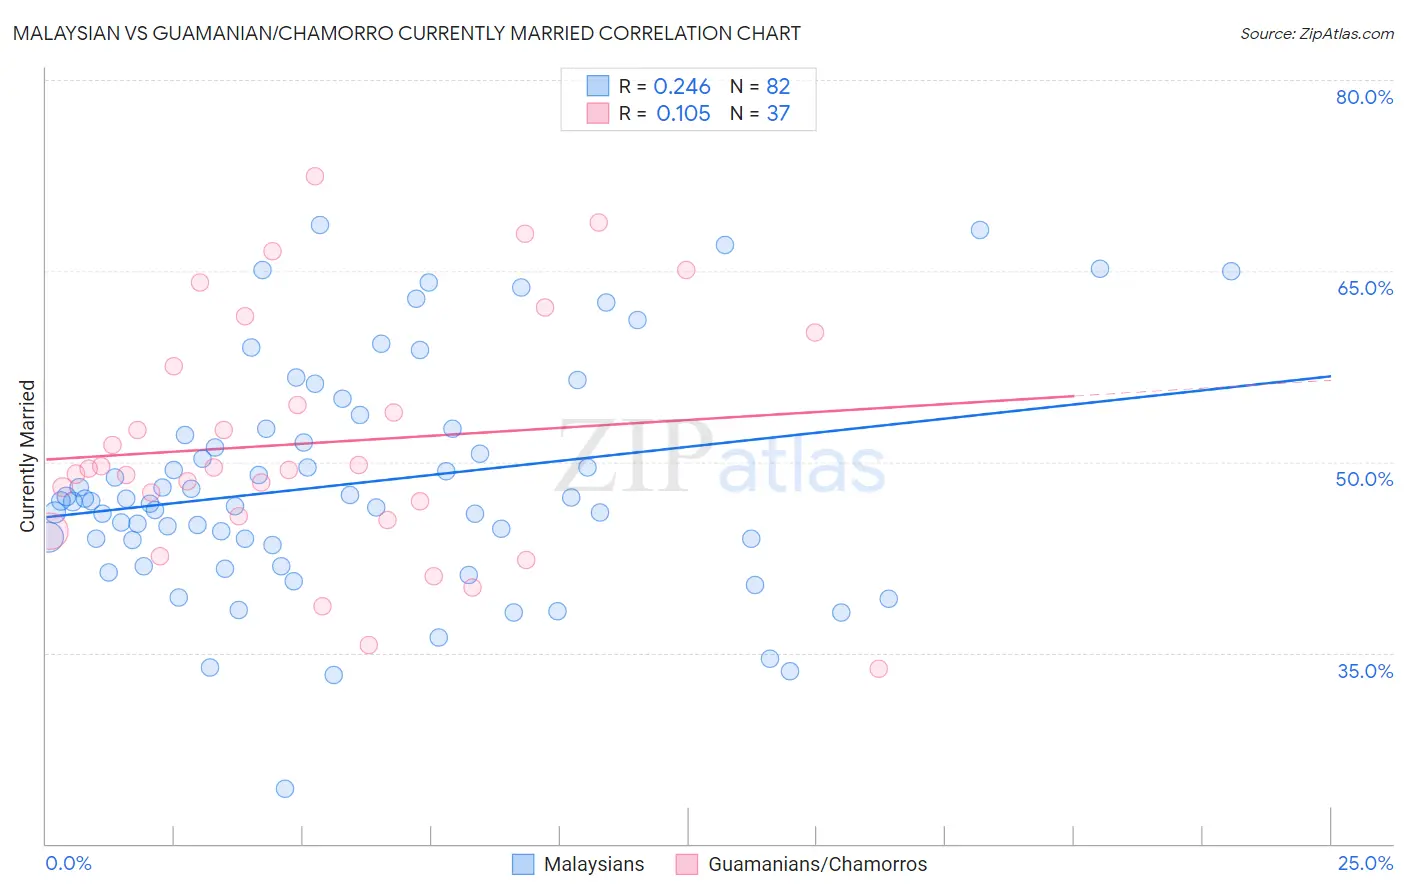
Malaysian vs Guamanian/Chamorro Currently Married Correlation Chart
The statistical analysis conducted on geographies consisting of 226,093,582 people shows a weak positive correlation between the proportion of Malaysians and percentage of population currently married in the United States with a correlation coefficient (R) of 0.246 and weighted average of 45.9%. Similarly, the statistical analysis conducted on geographies consisting of 221,951,395 people shows a poor positive correlation between the proportion of Guamanians/Chamorros and percentage of population currently married in the United States with a correlation coefficient (R) of 0.105 and weighted average of 47.1%, a difference of 2.6%.
Currently Married Correlation Summary
| Measurement | Malaysian | Guamanian/Chamorro |
| Minimum | 24.3% | 33.7% |
| Maximum | 68.6% | 72.4% |
| Range | 44.3% | 38.7% |
| Mean | 48.3% | 51.5% |
| Median | 46.9% | 49.5% |
| Interquartile 25% (IQ1) | 43.9% | 45.6% |
| Interquartile 75% (IQ3) | 52.6% | 58.9% |
| Interquartile Range (IQR) | 8.7% | 13.3% |
| Standard Deviation (Sample) | 8.9% | 9.5% |
| Standard Deviation (Population) | 8.9% | 9.4% |
Similar Demographics by Currently Married
Demographics Similar to Malaysians by Currently Married
In terms of currently married, the demographic groups most similar to Malaysians are Immigrants from Albania (45.9%, a difference of 0.060%), Creek (46.0%, a difference of 0.13%), Immigrants from Costa Rica (46.0%, a difference of 0.27%), Taiwanese (45.8%, a difference of 0.29%), and Immigrants from Spain (45.8%, a difference of 0.30%).
| Demographics | Rating | Rank | Currently Married |
| South Americans | 23.8 /100 | #194 | Fair 46.1% |
| Immigrants | Nepal | 23.7 /100 | #195 | Fair 46.1% |
| Immigrants | Bosnia and Herzegovina | 22.2 /100 | #196 | Fair 46.1% |
| Immigrants | Kuwait | 21.7 /100 | #197 | Fair 46.1% |
| Immigrants | Colombia | 21.0 /100 | #198 | Fair 46.1% |
| Immigrants | Costa Rica | 19.6 /100 | #199 | Poor 46.0% |
| Creek | 17.2 /100 | #200 | Poor 46.0% |
| Malaysians | 15.3 /100 | #201 | Poor 45.9% |
| Immigrants | Albania | 14.5 /100 | #202 | Poor 45.9% |
| Taiwanese | 11.7 /100 | #203 | Poor 45.8% |
| Immigrants | Spain | 11.6 /100 | #204 | Poor 45.8% |
| South American Indians | 11.5 /100 | #205 | Poor 45.8% |
| Immigrants | Immigrants | 11.2 /100 | #206 | Poor 45.8% |
| Immigrants | South America | 10.8 /100 | #207 | Poor 45.7% |
| Alsatians | 10.8 /100 | #208 | Poor 45.7% |
Demographics Similar to Guamanians/Chamorros by Currently Married
In terms of currently married, the demographic groups most similar to Guamanians/Chamorros are Venezuelan (47.1%, a difference of 0.010%), Argentinean (47.1%, a difference of 0.010%), Hmong (47.1%, a difference of 0.040%), Cajun (47.1%, a difference of 0.050%), and Immigrants from South Eastern Asia (47.1%, a difference of 0.060%).
| Demographics | Rating | Rank | Currently Married |
| Immigrants | Vietnam | 78.2 /100 | #136 | Good 47.2% |
| Paraguayans | 77.8 /100 | #137 | Good 47.2% |
| Pakistanis | 77.5 /100 | #138 | Good 47.2% |
| Yugoslavians | 77.4 /100 | #139 | Good 47.2% |
| Cajuns | 75.3 /100 | #140 | Good 47.1% |
| Venezuelans | 74.4 /100 | #141 | Good 47.1% |
| Argentineans | 74.4 /100 | #142 | Good 47.1% |
| Guamanians/Chamorros | 74.2 /100 | #143 | Good 47.1% |
| Hmong | 73.4 /100 | #144 | Good 47.1% |
| Immigrants | South Eastern Asia | 72.9 /100 | #145 | Good 47.1% |
| Carpatho Rusyns | 72.6 /100 | #146 | Good 47.0% |
| Immigrants | Argentina | 72.0 /100 | #147 | Good 47.0% |
| Cambodians | 70.4 /100 | #148 | Good 47.0% |
| Zimbabweans | 70.1 /100 | #149 | Good 47.0% |
| Immigrants | Turkey | 70.0 /100 | #150 | Good 47.0% |