Malaysian vs Creek College, 1 year or more
COMPARE
Malaysian
Creek
College, 1 year or more
College, 1 year or more Comparison
Malaysians
Creek
55.6%
COLLEGE, 1 YEAR OR MORE
0.8/ 100
METRIC RATING
246th/ 347
METRIC RANK
52.2%
COLLEGE, 1 YEAR OR MORE
0.0/ 100
METRIC RATING
303rd/ 347
METRIC RANK
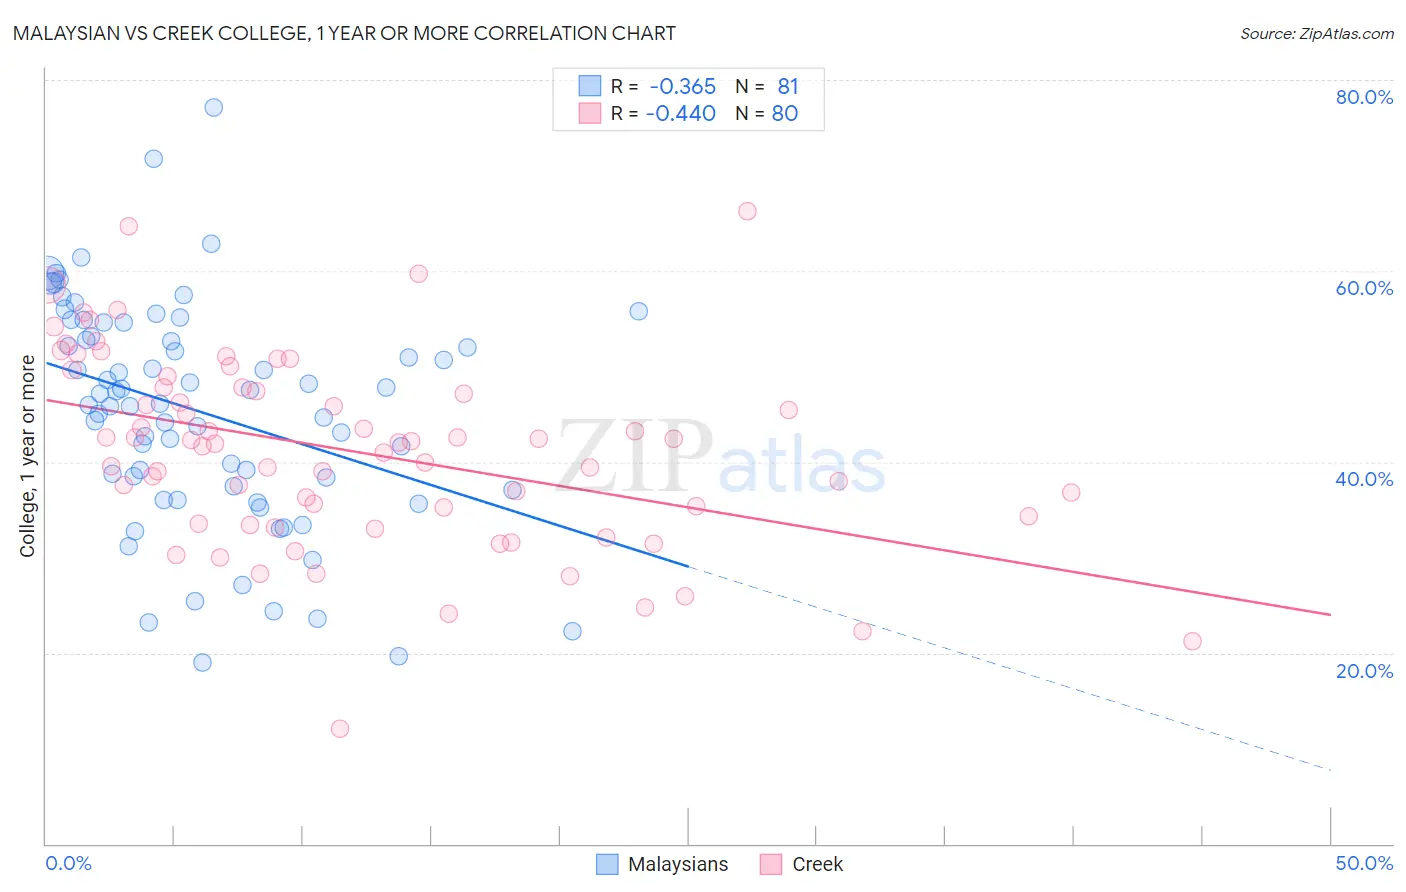
Malaysian vs Creek College, 1 year or more Correlation Chart
The statistical analysis conducted on geographies consisting of 226,108,921 people shows a mild negative correlation between the proportion of Malaysians and percentage of population with at least college, 1 year or more education in the United States with a correlation coefficient (R) of -0.365 and weighted average of 55.6%. Similarly, the statistical analysis conducted on geographies consisting of 178,480,714 people shows a moderate negative correlation between the proportion of Creek and percentage of population with at least college, 1 year or more education in the United States with a correlation coefficient (R) of -0.440 and weighted average of 52.2%, a difference of 6.6%.
College, 1 year or more Correlation Summary
| Measurement | Malaysian | Creek |
| Minimum | 19.0% | 12.0% |
| Maximum | 77.1% | 66.3% |
| Range | 58.1% | 54.2% |
| Mean | 45.2% | 41.1% |
| Median | 46.1% | 42.0% |
| Interquartile 25% (IQ1) | 37.3% | 33.9% |
| Interquartile 75% (IQ3) | 53.8% | 47.8% |
| Interquartile Range (IQR) | 16.5% | 13.9% |
| Standard Deviation (Sample) | 11.7% | 10.1% |
| Standard Deviation (Population) | 11.6% | 10.1% |
Similar Demographics by College, 1 year or more
Demographics Similar to Malaysians by College, 1 year or more
In terms of college, 1 year or more, the demographic groups most similar to Malaysians are Immigrants from Liberia (55.7%, a difference of 0.050%), Hawaiian (55.6%, a difference of 0.070%), Chippewa (55.7%, a difference of 0.11%), Immigrants from Congo (55.6%, a difference of 0.11%), and Immigrants from Trinidad and Tobago (55.5%, a difference of 0.21%).
| Demographics | Rating | Rank | College, 1 year or more |
| Puget Sound Salish | 1.1 /100 | #239 | Tragic 55.9% |
| Trinidadians and Tobagonians | 1.1 /100 | #240 | Tragic 55.8% |
| French American Indians | 1.0 /100 | #241 | Tragic 55.8% |
| Marshallese | 1.0 /100 | #242 | Tragic 55.8% |
| Osage | 1.0 /100 | #243 | Tragic 55.8% |
| Chippewa | 0.9 /100 | #244 | Tragic 55.7% |
| Immigrants | Liberia | 0.8 /100 | #245 | Tragic 55.7% |
| Malaysians | 0.8 /100 | #246 | Tragic 55.6% |
| Hawaiians | 0.8 /100 | #247 | Tragic 55.6% |
| Immigrants | Congo | 0.8 /100 | #248 | Tragic 55.6% |
| Immigrants | Trinidad and Tobago | 0.7 /100 | #249 | Tragic 55.5% |
| Delaware | 0.7 /100 | #250 | Tragic 55.5% |
| Immigrants | Cambodia | 0.6 /100 | #251 | Tragic 55.4% |
| Aleuts | 0.6 /100 | #252 | Tragic 55.4% |
| Immigrants | Barbados | 0.6 /100 | #253 | Tragic 55.4% |
Demographics Similar to Creek by College, 1 year or more
In terms of college, 1 year or more, the demographic groups most similar to Creek are Puerto Rican (52.2%, a difference of 0.080%), Central American (52.1%, a difference of 0.14%), Haitian (52.3%, a difference of 0.21%), Seminole (52.1%, a difference of 0.23%), and Choctaw (52.3%, a difference of 0.26%).
| Demographics | Rating | Rank | College, 1 year or more |
| Sioux | 0.0 /100 | #296 | Tragic 53.0% |
| Paiute | 0.0 /100 | #297 | Tragic 52.9% |
| Immigrants | Dominica | 0.0 /100 | #298 | Tragic 52.5% |
| Immigrants | Nicaragua | 0.0 /100 | #299 | Tragic 52.4% |
| Choctaw | 0.0 /100 | #300 | Tragic 52.3% |
| Haitians | 0.0 /100 | #301 | Tragic 52.3% |
| Puerto Ricans | 0.0 /100 | #302 | Tragic 52.2% |
| Creek | 0.0 /100 | #303 | Tragic 52.2% |
| Central Americans | 0.0 /100 | #304 | Tragic 52.1% |
| Seminole | 0.0 /100 | #305 | Tragic 52.1% |
| Mexican American Indians | 0.0 /100 | #306 | Tragic 51.9% |
| Immigrants | Portugal | 0.0 /100 | #307 | Tragic 51.9% |
| Salvadorans | 0.0 /100 | #308 | Tragic 51.8% |
| Apache | 0.0 /100 | #309 | Tragic 51.8% |
| Hondurans | 0.0 /100 | #310 | Tragic 51.6% |