Malaysian vs Guamanian/Chamorro Female Poverty Among 25-34 Year Olds
COMPARE
Malaysian
Guamanian/Chamorro
Female Poverty Among 25-34 Year Olds
Female Poverty Among 25-34 Year Olds Comparison
Malaysians
Guamanians/Chamorros
14.7%
FEMALE POVERTY AMONG 25-34 YEAR OLDS
1.4/ 100
METRIC RATING
239th/ 347
METRIC RANK
13.6%
FEMALE POVERTY AMONG 25-34 YEAR OLDS
41.5/ 100
METRIC RATING
181st/ 347
METRIC RANK
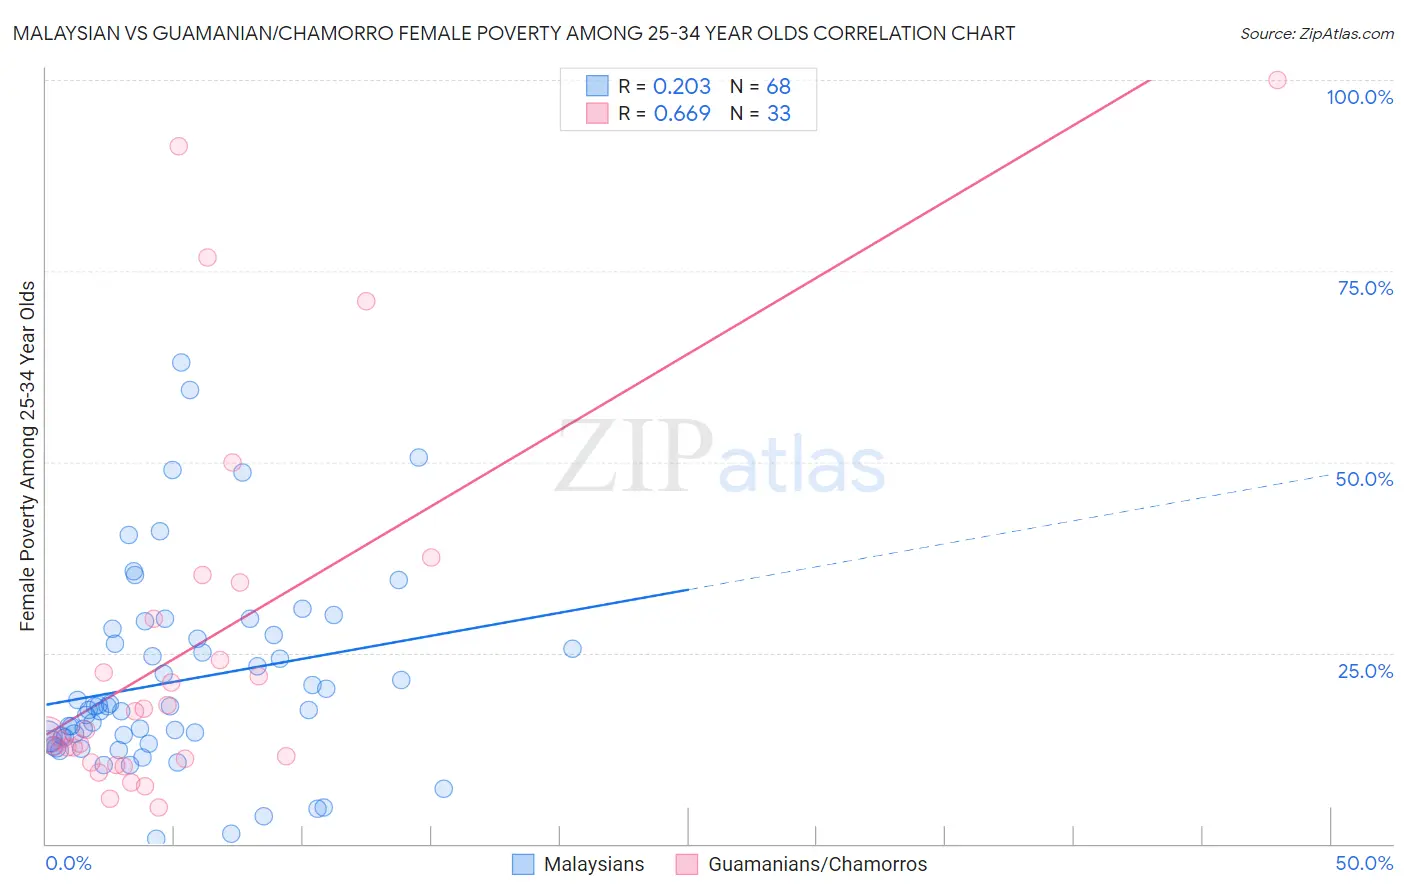
Malaysian vs Guamanian/Chamorro Female Poverty Among 25-34 Year Olds Correlation Chart
The statistical analysis conducted on geographies consisting of 224,654,876 people shows a weak positive correlation between the proportion of Malaysians and poverty level among females between the ages 25 and 34 in the United States with a correlation coefficient (R) of 0.203 and weighted average of 14.7%. Similarly, the statistical analysis conducted on geographies consisting of 220,375,299 people shows a significant positive correlation between the proportion of Guamanians/Chamorros and poverty level among females between the ages 25 and 34 in the United States with a correlation coefficient (R) of 0.669 and weighted average of 13.6%, a difference of 8.1%.
Female Poverty Among 25-34 Year Olds Correlation Summary
| Measurement | Malaysian | Guamanian/Chamorro |
| Minimum | 0.70% | 4.8% |
| Maximum | 63.1% | 100.0% |
| Range | 62.4% | 95.2% |
| Mean | 21.3% | 25.8% |
| Median | 17.8% | 14.8% |
| Interquartile 25% (IQ1) | 13.7% | 10.9% |
| Interquartile 75% (IQ3) | 27.1% | 31.8% |
| Interquartile Range (IQR) | 13.3% | 20.9% |
| Standard Deviation (Sample) | 12.8% | 24.7% |
| Standard Deviation (Population) | 12.7% | 24.3% |
Similar Demographics by Female Poverty Among 25-34 Year Olds
Demographics Similar to Malaysians by Female Poverty Among 25-34 Year Olds
In terms of female poverty among 25-34 year olds, the demographic groups most similar to Malaysians are Alsatian (14.7%, a difference of 0.030%), Immigrants from Grenada (14.7%, a difference of 0.050%), Salvadoran (14.7%, a difference of 0.070%), Immigrants from Ghana (14.7%, a difference of 0.070%), and Immigrants from Jamaica (14.7%, a difference of 0.090%).
| Demographics | Rating | Rank | Female Poverty Among 25-34 Year Olds |
| Immigrants | Ecuador | 1.9 /100 | #232 | Tragic 14.6% |
| Whites/Caucasians | 1.8 /100 | #233 | Tragic 14.7% |
| Cubans | 1.6 /100 | #234 | Tragic 14.7% |
| Immigrants | Jamaica | 1.4 /100 | #235 | Tragic 14.7% |
| Salvadorans | 1.4 /100 | #236 | Tragic 14.7% |
| Immigrants | Ghana | 1.4 /100 | #237 | Tragic 14.7% |
| Alsatians | 1.4 /100 | #238 | Tragic 14.7% |
| Malaysians | 1.4 /100 | #239 | Tragic 14.7% |
| Immigrants | Grenada | 1.3 /100 | #240 | Tragic 14.7% |
| Scotch-Irish | 1.2 /100 | #241 | Tragic 14.8% |
| Barbadians | 1.2 /100 | #242 | Tragic 14.8% |
| Immigrants | Nicaragua | 1.1 /100 | #243 | Tragic 14.8% |
| Immigrants | Bangladesh | 1.1 /100 | #244 | Tragic 14.8% |
| Immigrants | Middle Africa | 1.0 /100 | #245 | Tragic 14.8% |
| Jamaicans | 1.0 /100 | #246 | Tragic 14.8% |
Demographics Similar to Guamanians/Chamorros by Female Poverty Among 25-34 Year Olds
In terms of female poverty among 25-34 year olds, the demographic groups most similar to Guamanians/Chamorros are German (13.6%, a difference of 0.010%), Immigrants from Venezuela (13.6%, a difference of 0.070%), Portuguese (13.6%, a difference of 0.10%), Immigrants from Eastern Africa (13.6%, a difference of 0.17%), and Canadian (13.6%, a difference of 0.24%).
| Demographics | Rating | Rank | Female Poverty Among 25-34 Year Olds |
| Immigrants | Oceania | 50.0 /100 | #174 | Average 13.5% |
| Bermudans | 46.8 /100 | #175 | Average 13.6% |
| Yugoslavians | 45.0 /100 | #176 | Average 13.6% |
| Venezuelans | 44.6 /100 | #177 | Average 13.6% |
| Canadians | 44.3 /100 | #178 | Average 13.6% |
| Immigrants | Eastern Africa | 43.6 /100 | #179 | Average 13.6% |
| Germans | 41.6 /100 | #180 | Average 13.6% |
| Guamanians/Chamorros | 41.5 /100 | #181 | Average 13.6% |
| Immigrants | Venezuela | 40.7 /100 | #182 | Average 13.6% |
| Portuguese | 40.3 /100 | #183 | Average 13.6% |
| Czechoslovakians | 36.8 /100 | #184 | Fair 13.7% |
| Irish | 35.3 /100 | #185 | Fair 13.7% |
| Immigrants | Uruguay | 34.1 /100 | #186 | Fair 13.7% |
| Slovaks | 34.1 /100 | #187 | Fair 13.7% |
| Immigrants | Eritrea | 32.7 /100 | #188 | Fair 13.7% |