Malaysian vs Guamanian/Chamorro Unemployment Among Youth under 25 years
COMPARE
Malaysian
Guamanian/Chamorro
Unemployment Among Youth under 25 years
Unemployment Among Youth under 25 years Comparison
Malaysians
Guamanians/Chamorros
11.4%
UNEMPLOYMENT AMONG YOUTH UNDER 25 YEARS
89.0/ 100
METRIC RATING
120th/ 347
METRIC RANK
11.9%
UNEMPLOYMENT AMONG YOUTH UNDER 25 YEARS
7.0/ 100
METRIC RATING
216th/ 347
METRIC RANK
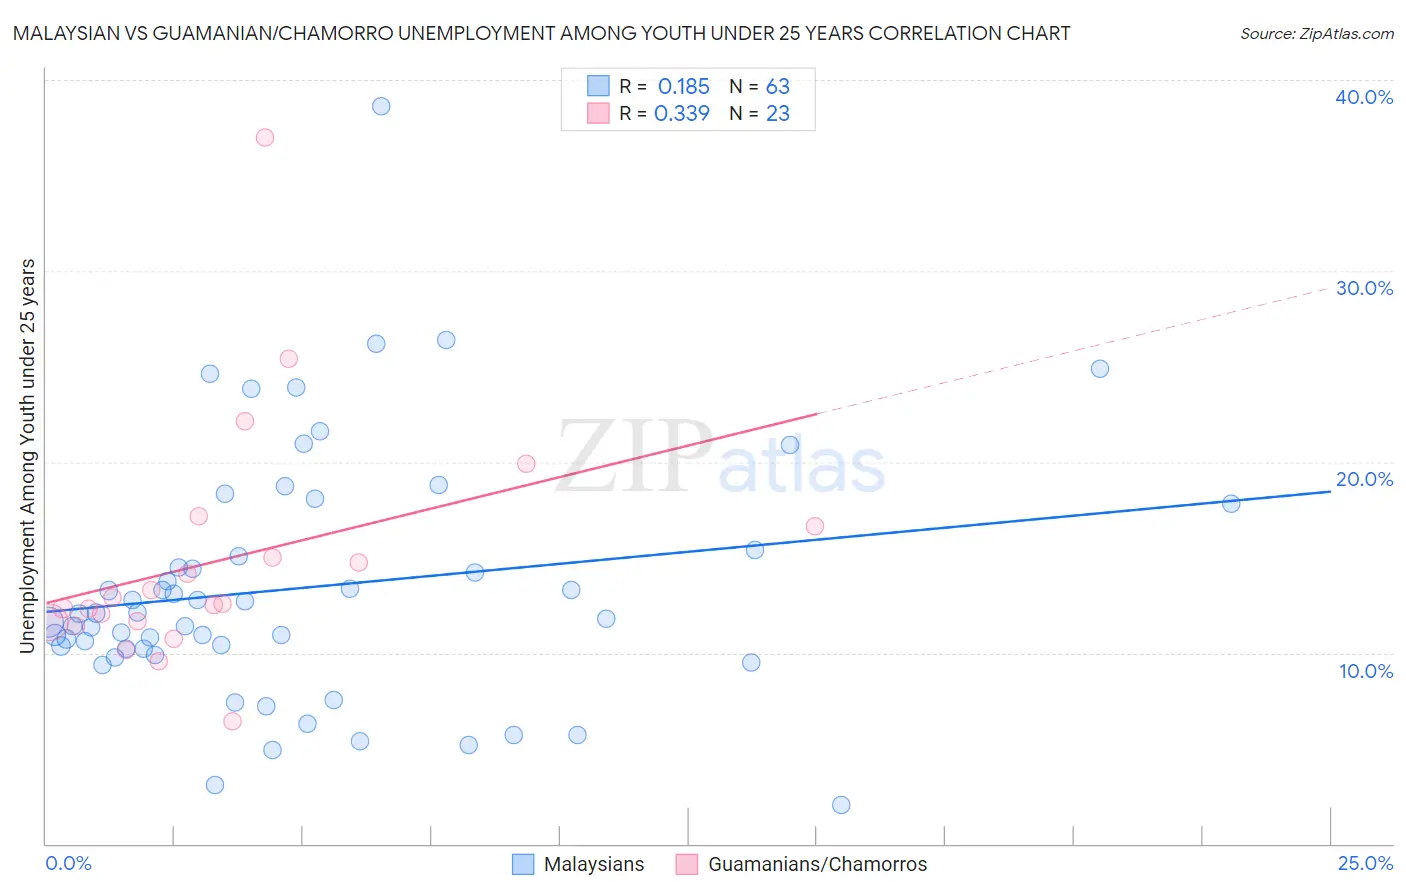
Malaysian vs Guamanian/Chamorro Unemployment Among Youth under 25 years Correlation Chart
The statistical analysis conducted on geographies consisting of 224,897,730 people shows a poor positive correlation between the proportion of Malaysians and unemployment rate among youth under the age of 25 in the United States with a correlation coefficient (R) of 0.185 and weighted average of 11.4%. Similarly, the statistical analysis conducted on geographies consisting of 220,678,846 people shows a mild positive correlation between the proportion of Guamanians/Chamorros and unemployment rate among youth under the age of 25 in the United States with a correlation coefficient (R) of 0.339 and weighted average of 11.9%, a difference of 4.9%.
Unemployment Among Youth under 25 years Correlation Summary
| Measurement | Malaysian | Guamanian/Chamorro |
| Minimum | 2.0% | 6.4% |
| Maximum | 38.6% | 37.0% |
| Range | 36.6% | 30.6% |
| Mean | 13.4% | 14.8% |
| Median | 12.0% | 12.6% |
| Interquartile 25% (IQ1) | 10.2% | 11.6% |
| Interquartile 75% (IQ3) | 15.4% | 16.6% |
| Interquartile Range (IQR) | 5.2% | 5.0% |
| Standard Deviation (Sample) | 6.5% | 6.4% |
| Standard Deviation (Population) | 6.5% | 6.2% |
Similar Demographics by Unemployment Among Youth under 25 years
Demographics Similar to Malaysians by Unemployment Among Youth under 25 years
In terms of unemployment among youth under 25 years, the demographic groups most similar to Malaysians are Immigrants from Scotland (11.4%, a difference of 0.020%), Slovak (11.4%, a difference of 0.020%), Afghan (11.3%, a difference of 0.070%), Sri Lankan (11.3%, a difference of 0.080%), and Burmese (11.3%, a difference of 0.090%).
| Demographics | Rating | Rank | Unemployment Among Youth under 25 years |
| Fijians | 90.2 /100 | #113 | Exceptional 11.3% |
| Immigrants | Ethiopia | 89.9 /100 | #114 | Excellent 11.3% |
| Immigrants | Vietnam | 89.9 /100 | #115 | Excellent 11.3% |
| Burmese | 89.8 /100 | #116 | Excellent 11.3% |
| Sri Lankans | 89.8 /100 | #117 | Excellent 11.3% |
| Afghans | 89.7 /100 | #118 | Excellent 11.3% |
| Immigrants | Scotland | 89.2 /100 | #119 | Excellent 11.4% |
| Malaysians | 89.0 /100 | #120 | Excellent 11.4% |
| Slovaks | 88.9 /100 | #121 | Excellent 11.4% |
| Immigrants | Micronesia | 88.1 /100 | #122 | Excellent 11.4% |
| Basques | 87.8 /100 | #123 | Excellent 11.4% |
| Italians | 87.2 /100 | #124 | Excellent 11.4% |
| Immigrants | Argentina | 87.2 /100 | #125 | Excellent 11.4% |
| Canadians | 86.6 /100 | #126 | Excellent 11.4% |
| Greeks | 86.2 /100 | #127 | Excellent 11.4% |
Demographics Similar to Guamanians/Chamorros by Unemployment Among Youth under 25 years
In terms of unemployment among youth under 25 years, the demographic groups most similar to Guamanians/Chamorros are Yaqui (11.9%, a difference of 0.010%), Immigrants from Middle Africa (11.9%, a difference of 0.020%), Samoan (11.9%, a difference of 0.060%), Nonimmigrants (11.9%, a difference of 0.13%), and Alsatian (11.9%, a difference of 0.15%).
| Demographics | Rating | Rank | Unemployment Among Youth under 25 years |
| Immigrants | Lebanon | 11.3 /100 | #209 | Poor 11.8% |
| Assyrians/Chaldeans/Syriacs | 9.8 /100 | #210 | Tragic 11.9% |
| Immigrants | Philippines | 9.2 /100 | #211 | Tragic 11.9% |
| Colombians | 9.1 /100 | #212 | Tragic 11.9% |
| South Americans | 8.5 /100 | #213 | Tragic 11.9% |
| Costa Ricans | 8.2 /100 | #214 | Tragic 11.9% |
| Samoans | 7.4 /100 | #215 | Tragic 11.9% |
| Guamanians/Chamorros | 7.0 /100 | #216 | Tragic 11.9% |
| Yaqui | 6.9 /100 | #217 | Tragic 11.9% |
| Immigrants | Middle Africa | 6.8 /100 | #218 | Tragic 11.9% |
| Immigrants | Nonimmigrants | 6.2 /100 | #219 | Tragic 11.9% |
| Alsatians | 6.1 /100 | #220 | Tragic 11.9% |
| Immigrants | Portugal | 4.9 /100 | #221 | Tragic 12.0% |
| Israelis | 4.1 /100 | #222 | Tragic 12.0% |
| Immigrants | Ireland | 3.5 /100 | #223 | Tragic 12.0% |