Lumbee vs Venezuelan College, Under 1 year
COMPARE
Lumbee
Venezuelan
College, Under 1 year
College, Under 1 year Comparison
Lumbee
Venezuelans
54.2%
COLLEGE, UNDER 1 YEAR
0.0/ 100
METRIC RATING
338th/ 347
METRIC RANK
66.7%
COLLEGE, UNDER 1 YEAR
85.9/ 100
METRIC RATING
139th/ 347
METRIC RANK
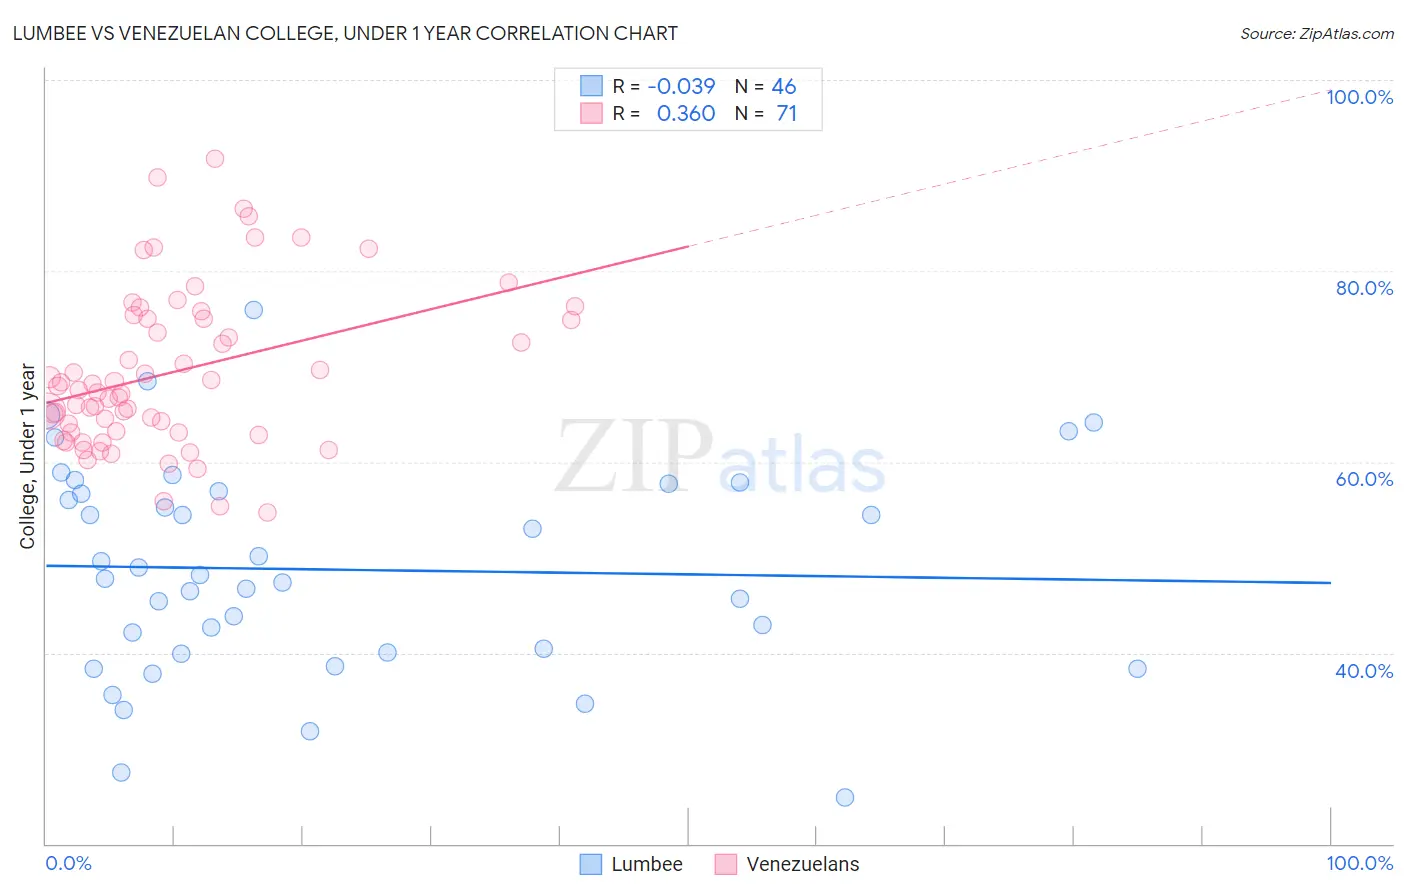
Lumbee vs Venezuelan College, Under 1 year Correlation Chart
The statistical analysis conducted on geographies consisting of 92,299,068 people shows no correlation between the proportion of Lumbee and percentage of population with at least college, under 1 year education in the United States with a correlation coefficient (R) of -0.039 and weighted average of 54.2%. Similarly, the statistical analysis conducted on geographies consisting of 306,323,601 people shows a mild positive correlation between the proportion of Venezuelans and percentage of population with at least college, under 1 year education in the United States with a correlation coefficient (R) of 0.360 and weighted average of 66.7%, a difference of 23.1%.
College, Under 1 year Correlation Summary
| Measurement | Lumbee | Venezuelan |
| Minimum | 24.8% | 54.6% |
| Maximum | 75.9% | 91.7% |
| Range | 51.1% | 37.1% |
| Mean | 48.7% | 69.4% |
| Median | 47.9% | 67.5% |
| Interquartile 25% (IQ1) | 40.0% | 63.1% |
| Interquartile 75% (IQ3) | 56.9% | 75.1% |
| Interquartile Range (IQR) | 16.9% | 12.0% |
| Standard Deviation (Sample) | 11.1% | 8.3% |
| Standard Deviation (Population) | 11.0% | 8.2% |
Similar Demographics by College, Under 1 year
Demographics Similar to Lumbee by College, Under 1 year
In terms of college, under 1 year, the demographic groups most similar to Lumbee are Immigrants from Dominican Republic (54.0%, a difference of 0.40%), Immigrants from Central America (54.4%, a difference of 0.41%), Spanish American Indian (54.0%, a difference of 0.49%), Pennsylvania German (54.5%, a difference of 0.56%), and Inupiat (54.6%, a difference of 0.73%).
| Demographics | Rating | Rank | College, Under 1 year |
| Dominicans | 0.0 /100 | #331 | Tragic 55.5% |
| Immigrants | Yemen | 0.0 /100 | #332 | Tragic 55.3% |
| Yuman | 0.0 /100 | #333 | Tragic 55.1% |
| Immigrants | Azores | 0.0 /100 | #334 | Tragic 54.7% |
| Inupiat | 0.0 /100 | #335 | Tragic 54.6% |
| Pennsylvania Germans | 0.0 /100 | #336 | Tragic 54.5% |
| Immigrants | Central America | 0.0 /100 | #337 | Tragic 54.4% |
| Lumbee | 0.0 /100 | #338 | Tragic 54.2% |
| Immigrants | Dominican Republic | 0.0 /100 | #339 | Tragic 54.0% |
| Spanish American Indians | 0.0 /100 | #340 | Tragic 54.0% |
| Immigrants | Cabo Verde | 0.0 /100 | #341 | Tragic 53.7% |
| Immigrants | Mexico | 0.0 /100 | #342 | Tragic 53.7% |
| Tohono O'odham | 0.0 /100 | #343 | Tragic 52.8% |
| Yakama | 0.0 /100 | #344 | Tragic 52.6% |
| Pima | 0.0 /100 | #345 | Tragic 51.4% |
Demographics Similar to Venezuelans by College, Under 1 year
In terms of college, under 1 year, the demographic groups most similar to Venezuelans are Slavic (66.7%, a difference of 0.0%), Immigrants from Afghanistan (66.7%, a difference of 0.070%), Immigrants from Italy (66.8%, a difference of 0.10%), Immigrants from Chile (66.8%, a difference of 0.14%), and Ugandan (66.8%, a difference of 0.18%).
| Demographics | Rating | Rank | College, Under 1 year |
| Poles | 88.4 /100 | #132 | Excellent 66.9% |
| Immigrants | Brazil | 88.3 /100 | #133 | Excellent 66.9% |
| Iraqis | 88.0 /100 | #134 | Excellent 66.8% |
| Canadians | 87.9 /100 | #135 | Excellent 66.8% |
| Ugandans | 87.8 /100 | #136 | Excellent 66.8% |
| Immigrants | Chile | 87.4 /100 | #137 | Excellent 66.8% |
| Immigrants | Italy | 86.9 /100 | #138 | Excellent 66.8% |
| Venezuelans | 85.9 /100 | #139 | Excellent 66.7% |
| Slavs | 85.9 /100 | #140 | Excellent 66.7% |
| Immigrants | Afghanistan | 85.1 /100 | #141 | Excellent 66.7% |
| English | 82.9 /100 | #142 | Excellent 66.6% |
| Immigrants | Uganda | 82.8 /100 | #143 | Excellent 66.5% |
| Immigrants | Germany | 82.0 /100 | #144 | Excellent 66.5% |
| Immigrants | Kenya | 81.8 /100 | #145 | Excellent 66.5% |
| Kenyans | 81.7 /100 | #146 | Excellent 66.5% |