Lumbee vs Immigrants from Eastern Asia College, Under 1 year
COMPARE
Lumbee
Immigrants from Eastern Asia
College, Under 1 year
College, Under 1 year Comparison
Lumbee
Immigrants from Eastern Asia
54.2%
COLLEGE, UNDER 1 YEAR
0.0/ 100
METRIC RATING
338th/ 347
METRIC RANK
71.3%
COLLEGE, UNDER 1 YEAR
100.0/ 100
METRIC RATING
22nd/ 347
METRIC RANK
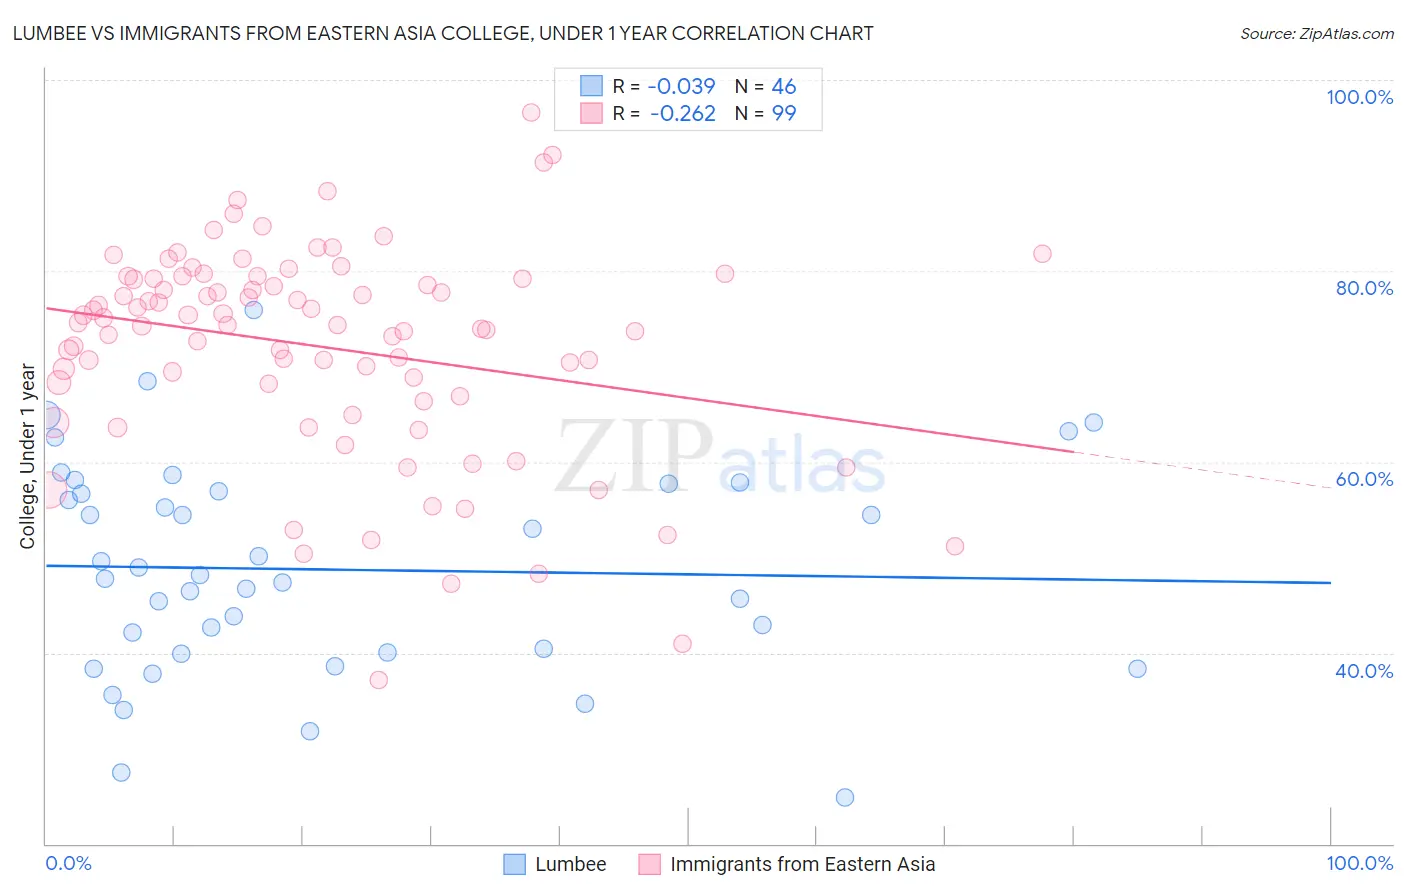
Lumbee vs Immigrants from Eastern Asia College, Under 1 year Correlation Chart
The statistical analysis conducted on geographies consisting of 92,299,068 people shows no correlation between the proportion of Lumbee and percentage of population with at least college, under 1 year education in the United States with a correlation coefficient (R) of -0.039 and weighted average of 54.2%. Similarly, the statistical analysis conducted on geographies consisting of 499,935,420 people shows a weak negative correlation between the proportion of Immigrants from Eastern Asia and percentage of population with at least college, under 1 year education in the United States with a correlation coefficient (R) of -0.262 and weighted average of 71.3%, a difference of 31.5%.
College, Under 1 year Correlation Summary
| Measurement | Lumbee | Immigrants from Eastern Asia |
| Minimum | 24.8% | 37.2% |
| Maximum | 75.9% | 96.6% |
| Range | 51.1% | 59.5% |
| Mean | 48.7% | 72.1% |
| Median | 47.9% | 74.4% |
| Interquartile 25% (IQ1) | 40.0% | 66.9% |
| Interquartile 75% (IQ3) | 56.9% | 79.2% |
| Interquartile Range (IQR) | 16.9% | 12.4% |
| Standard Deviation (Sample) | 11.1% | 11.1% |
| Standard Deviation (Population) | 11.0% | 11.0% |
Similar Demographics by College, Under 1 year
Demographics Similar to Lumbee by College, Under 1 year
In terms of college, under 1 year, the demographic groups most similar to Lumbee are Immigrants from Dominican Republic (54.0%, a difference of 0.40%), Immigrants from Central America (54.4%, a difference of 0.41%), Spanish American Indian (54.0%, a difference of 0.49%), Pennsylvania German (54.5%, a difference of 0.56%), and Inupiat (54.6%, a difference of 0.73%).
| Demographics | Rating | Rank | College, Under 1 year |
| Dominicans | 0.0 /100 | #331 | Tragic 55.5% |
| Immigrants | Yemen | 0.0 /100 | #332 | Tragic 55.3% |
| Yuman | 0.0 /100 | #333 | Tragic 55.1% |
| Immigrants | Azores | 0.0 /100 | #334 | Tragic 54.7% |
| Inupiat | 0.0 /100 | #335 | Tragic 54.6% |
| Pennsylvania Germans | 0.0 /100 | #336 | Tragic 54.5% |
| Immigrants | Central America | 0.0 /100 | #337 | Tragic 54.4% |
| Lumbee | 0.0 /100 | #338 | Tragic 54.2% |
| Immigrants | Dominican Republic | 0.0 /100 | #339 | Tragic 54.0% |
| Spanish American Indians | 0.0 /100 | #340 | Tragic 54.0% |
| Immigrants | Cabo Verde | 0.0 /100 | #341 | Tragic 53.7% |
| Immigrants | Mexico | 0.0 /100 | #342 | Tragic 53.7% |
| Tohono O'odham | 0.0 /100 | #343 | Tragic 52.8% |
| Yakama | 0.0 /100 | #344 | Tragic 52.6% |
| Pima | 0.0 /100 | #345 | Tragic 51.4% |
Demographics Similar to Immigrants from Eastern Asia by College, Under 1 year
In terms of college, under 1 year, the demographic groups most similar to Immigrants from Eastern Asia are Immigrants from Northern Europe (71.1%, a difference of 0.23%), Soviet Union (71.1%, a difference of 0.24%), Immigrants from Belgium (71.5%, a difference of 0.25%), Bulgarian (71.1%, a difference of 0.25%), and Immigrants from Denmark (71.0%, a difference of 0.37%).
| Demographics | Rating | Rank | College, Under 1 year |
| Burmese | 100.0 /100 | #15 | Exceptional 71.9% |
| Immigrants | Japan | 100.0 /100 | #16 | Exceptional 71.9% |
| Eastern Europeans | 100.0 /100 | #17 | Exceptional 71.8% |
| Immigrants | Switzerland | 100.0 /100 | #18 | Exceptional 71.7% |
| Latvians | 100.0 /100 | #19 | Exceptional 71.6% |
| Immigrants | Korea | 100.0 /100 | #20 | Exceptional 71.6% |
| Immigrants | Belgium | 100.0 /100 | #21 | Exceptional 71.5% |
| Immigrants | Eastern Asia | 100.0 /100 | #22 | Exceptional 71.3% |
| Immigrants | Northern Europe | 100.0 /100 | #23 | Exceptional 71.1% |
| Soviet Union | 100.0 /100 | #24 | Exceptional 71.1% |
| Bulgarians | 100.0 /100 | #25 | Exceptional 71.1% |
| Immigrants | Denmark | 100.0 /100 | #26 | Exceptional 71.0% |
| Immigrants | Ireland | 100.0 /100 | #27 | Exceptional 71.0% |
| Immigrants | Hong Kong | 100.0 /100 | #28 | Exceptional 71.0% |
| Immigrants | France | 100.0 /100 | #29 | Exceptional 71.0% |