Lumbee vs Immigrants from Central America College, Under 1 year
COMPARE
Lumbee
Immigrants from Central America
College, Under 1 year
College, Under 1 year Comparison
Lumbee
Immigrants from Central America
54.2%
COLLEGE, UNDER 1 YEAR
0.0/ 100
METRIC RATING
338th/ 347
METRIC RANK
54.4%
COLLEGE, UNDER 1 YEAR
0.0/ 100
METRIC RATING
337th/ 347
METRIC RANK
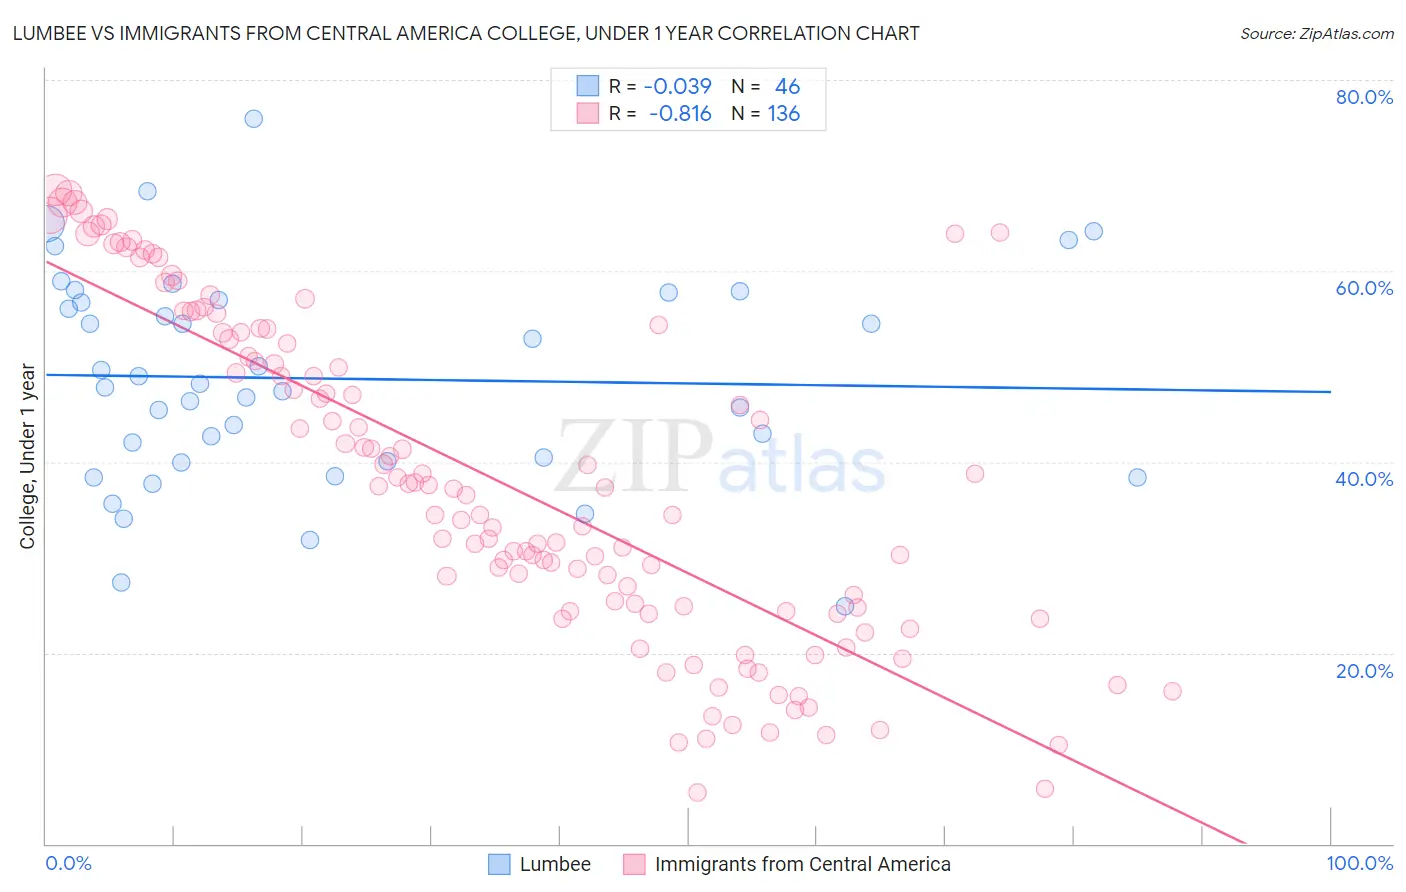
Lumbee vs Immigrants from Central America College, Under 1 year Correlation Chart
The statistical analysis conducted on geographies consisting of 92,299,068 people shows no correlation between the proportion of Lumbee and percentage of population with at least college, under 1 year education in the United States with a correlation coefficient (R) of -0.039 and weighted average of 54.2%. Similarly, the statistical analysis conducted on geographies consisting of 536,541,976 people shows a very strong negative correlation between the proportion of Immigrants from Central America and percentage of population with at least college, under 1 year education in the United States with a correlation coefficient (R) of -0.816 and weighted average of 54.4%, a difference of 0.41%.
College, Under 1 year Correlation Summary
| Measurement | Lumbee | Immigrants from Central America |
| Minimum | 24.8% | 5.4% |
| Maximum | 75.9% | 68.5% |
| Range | 51.1% | 63.2% |
| Mean | 48.7% | 38.1% |
| Median | 47.9% | 37.3% |
| Interquartile 25% (IQ1) | 40.0% | 24.5% |
| Interquartile 75% (IQ3) | 56.9% | 53.5% |
| Interquartile Range (IQR) | 16.9% | 29.0% |
| Standard Deviation (Sample) | 11.1% | 17.1% |
| Standard Deviation (Population) | 11.0% | 17.0% |
Demographics Similar to Lumbee and Immigrants from Central America by College, Under 1 year
In terms of college, under 1 year, the demographic groups most similar to Lumbee are Immigrants from Dominican Republic (54.0%, a difference of 0.40%), Spanish American Indian (54.0%, a difference of 0.49%), Pennsylvania German (54.5%, a difference of 0.56%), Inupiat (54.6%, a difference of 0.73%), and Immigrants from the Azores (54.7%, a difference of 0.86%). Similarly, the demographic groups most similar to Immigrants from Central America are Pennsylvania German (54.5%, a difference of 0.15%), Inupiat (54.6%, a difference of 0.32%), Immigrants from the Azores (54.7%, a difference of 0.45%), Immigrants from Dominican Republic (54.0%, a difference of 0.81%), and Spanish American Indian (54.0%, a difference of 0.90%).
| Demographics | Rating | Rank | College, Under 1 year |
| Immigrants | Guatemala | 0.0 /100 | #327 | Tragic 56.2% |
| Cape Verdeans | 0.0 /100 | #328 | Tragic 56.0% |
| Immigrants | Cuba | 0.0 /100 | #329 | Tragic 55.7% |
| Mexicans | 0.0 /100 | #330 | Tragic 55.6% |
| Dominicans | 0.0 /100 | #331 | Tragic 55.5% |
| Immigrants | Yemen | 0.0 /100 | #332 | Tragic 55.3% |
| Yuman | 0.0 /100 | #333 | Tragic 55.1% |
| Immigrants | Azores | 0.0 /100 | #334 | Tragic 54.7% |
| Inupiat | 0.0 /100 | #335 | Tragic 54.6% |
| Pennsylvania Germans | 0.0 /100 | #336 | Tragic 54.5% |
| Immigrants | Central America | 0.0 /100 | #337 | Tragic 54.4% |
| Lumbee | 0.0 /100 | #338 | Tragic 54.2% |
| Immigrants | Dominican Republic | 0.0 /100 | #339 | Tragic 54.0% |
| Spanish American Indians | 0.0 /100 | #340 | Tragic 54.0% |
| Immigrants | Cabo Verde | 0.0 /100 | #341 | Tragic 53.7% |
| Immigrants | Mexico | 0.0 /100 | #342 | Tragic 53.7% |
| Tohono O'odham | 0.0 /100 | #343 | Tragic 52.8% |
| Yakama | 0.0 /100 | #344 | Tragic 52.6% |
| Pima | 0.0 /100 | #345 | Tragic 51.4% |
| Houma | 0.0 /100 | #346 | Tragic 47.6% |
| Yup'ik | 0.0 /100 | #347 | Tragic 45.8% |