Lumbee vs Hispanic or Latino College, Under 1 year
COMPARE
Lumbee
Hispanic or Latino
College, Under 1 year
College, Under 1 year Comparison
Lumbee
Hispanics or Latinos
54.2%
COLLEGE, UNDER 1 YEAR
0.0/ 100
METRIC RATING
338th/ 347
METRIC RANK
57.0%
COLLEGE, UNDER 1 YEAR
0.0/ 100
METRIC RATING
317th/ 347
METRIC RANK
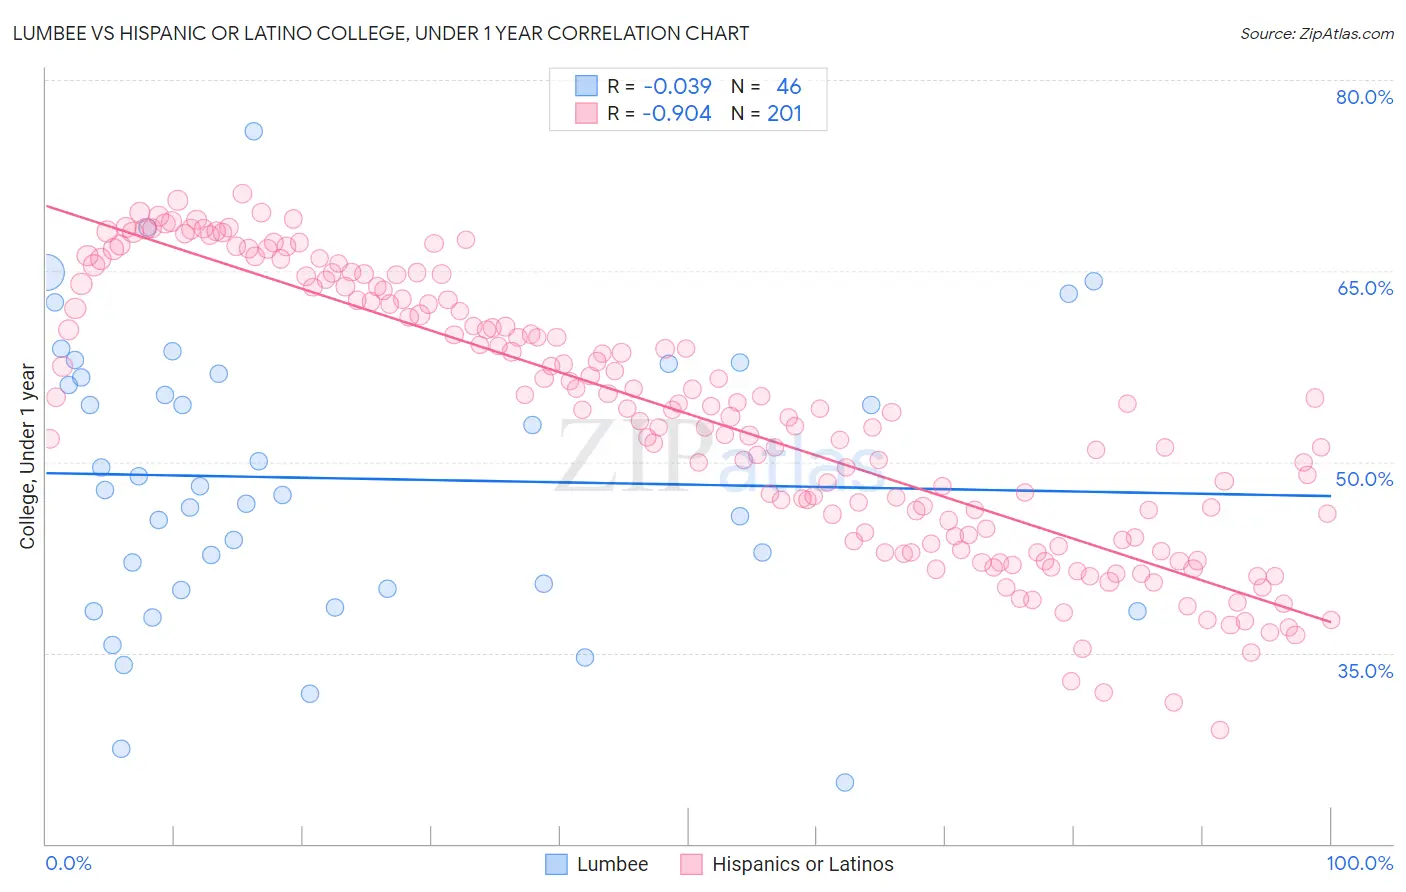
Lumbee vs Hispanic or Latino College, Under 1 year Correlation Chart
The statistical analysis conducted on geographies consisting of 92,299,068 people shows no correlation between the proportion of Lumbee and percentage of population with at least college, under 1 year education in the United States with a correlation coefficient (R) of -0.039 and weighted average of 54.2%. Similarly, the statistical analysis conducted on geographies consisting of 578,595,027 people shows a near-perfect negative correlation between the proportion of Hispanics or Latinos and percentage of population with at least college, under 1 year education in the United States with a correlation coefficient (R) of -0.904 and weighted average of 57.0%, a difference of 5.2%.
College, Under 1 year Correlation Summary
| Measurement | Lumbee | Hispanic or Latino |
| Minimum | 24.8% | 29.0% |
| Maximum | 75.9% | 71.0% |
| Range | 51.1% | 42.1% |
| Mean | 48.7% | 53.7% |
| Median | 47.9% | 54.2% |
| Interquartile 25% (IQ1) | 40.0% | 44.1% |
| Interquartile 75% (IQ3) | 56.9% | 63.6% |
| Interquartile Range (IQR) | 16.9% | 19.5% |
| Standard Deviation (Sample) | 11.1% | 10.5% |
| Standard Deviation (Population) | 11.0% | 10.5% |
Similar Demographics by College, Under 1 year
Demographics Similar to Lumbee by College, Under 1 year
In terms of college, under 1 year, the demographic groups most similar to Lumbee are Immigrants from Dominican Republic (54.0%, a difference of 0.40%), Immigrants from Central America (54.4%, a difference of 0.41%), Spanish American Indian (54.0%, a difference of 0.49%), Pennsylvania German (54.5%, a difference of 0.56%), and Inupiat (54.6%, a difference of 0.73%).
| Demographics | Rating | Rank | College, Under 1 year |
| Dominicans | 0.0 /100 | #331 | Tragic 55.5% |
| Immigrants | Yemen | 0.0 /100 | #332 | Tragic 55.3% |
| Yuman | 0.0 /100 | #333 | Tragic 55.1% |
| Immigrants | Azores | 0.0 /100 | #334 | Tragic 54.7% |
| Inupiat | 0.0 /100 | #335 | Tragic 54.6% |
| Pennsylvania Germans | 0.0 /100 | #336 | Tragic 54.5% |
| Immigrants | Central America | 0.0 /100 | #337 | Tragic 54.4% |
| Lumbee | 0.0 /100 | #338 | Tragic 54.2% |
| Immigrants | Dominican Republic | 0.0 /100 | #339 | Tragic 54.0% |
| Spanish American Indians | 0.0 /100 | #340 | Tragic 54.0% |
| Immigrants | Cabo Verde | 0.0 /100 | #341 | Tragic 53.7% |
| Immigrants | Mexico | 0.0 /100 | #342 | Tragic 53.7% |
| Tohono O'odham | 0.0 /100 | #343 | Tragic 52.8% |
| Yakama | 0.0 /100 | #344 | Tragic 52.6% |
| Pima | 0.0 /100 | #345 | Tragic 51.4% |
Demographics Similar to Hispanics or Latinos by College, Under 1 year
In terms of college, under 1 year, the demographic groups most similar to Hispanics or Latinos are Menominee (57.0%, a difference of 0.040%), Honduran (57.1%, a difference of 0.090%), Immigrants from Haiti (56.9%, a difference of 0.12%), Hopi (57.1%, a difference of 0.14%), and Dutch West Indian (57.2%, a difference of 0.26%).
| Demographics | Rating | Rank | College, Under 1 year |
| Pueblo | 0.0 /100 | #310 | Tragic 57.4% |
| Cajuns | 0.0 /100 | #311 | Tragic 57.3% |
| Salvadorans | 0.0 /100 | #312 | Tragic 57.3% |
| Dutch West Indians | 0.0 /100 | #313 | Tragic 57.2% |
| Hopi | 0.0 /100 | #314 | Tragic 57.1% |
| Hondurans | 0.0 /100 | #315 | Tragic 57.1% |
| Menominee | 0.0 /100 | #316 | Tragic 57.0% |
| Hispanics or Latinos | 0.0 /100 | #317 | Tragic 57.0% |
| Immigrants | Haiti | 0.0 /100 | #318 | Tragic 56.9% |
| Puerto Ricans | 0.0 /100 | #319 | Tragic 56.8% |
| Guatemalans | 0.0 /100 | #320 | Tragic 56.8% |
| Natives/Alaskans | 0.0 /100 | #321 | Tragic 56.6% |
| Immigrants | Caribbean | 0.0 /100 | #322 | Tragic 56.6% |
| Immigrants | Honduras | 0.0 /100 | #323 | Tragic 56.5% |
| Immigrants | El Salvador | 0.0 /100 | #324 | Tragic 56.4% |