Lumbee vs Venezuelan Vision Disability
COMPARE
Lumbee
Venezuelan
Vision Disability
Vision Disability Comparison
Lumbee
Venezuelans
3.4%
VISION DISABILITY
0.0/ 100
METRIC RATING
345th/ 347
METRIC RANK
2.1%
VISION DISABILITY
87.2/ 100
METRIC RATING
134th/ 347
METRIC RANK
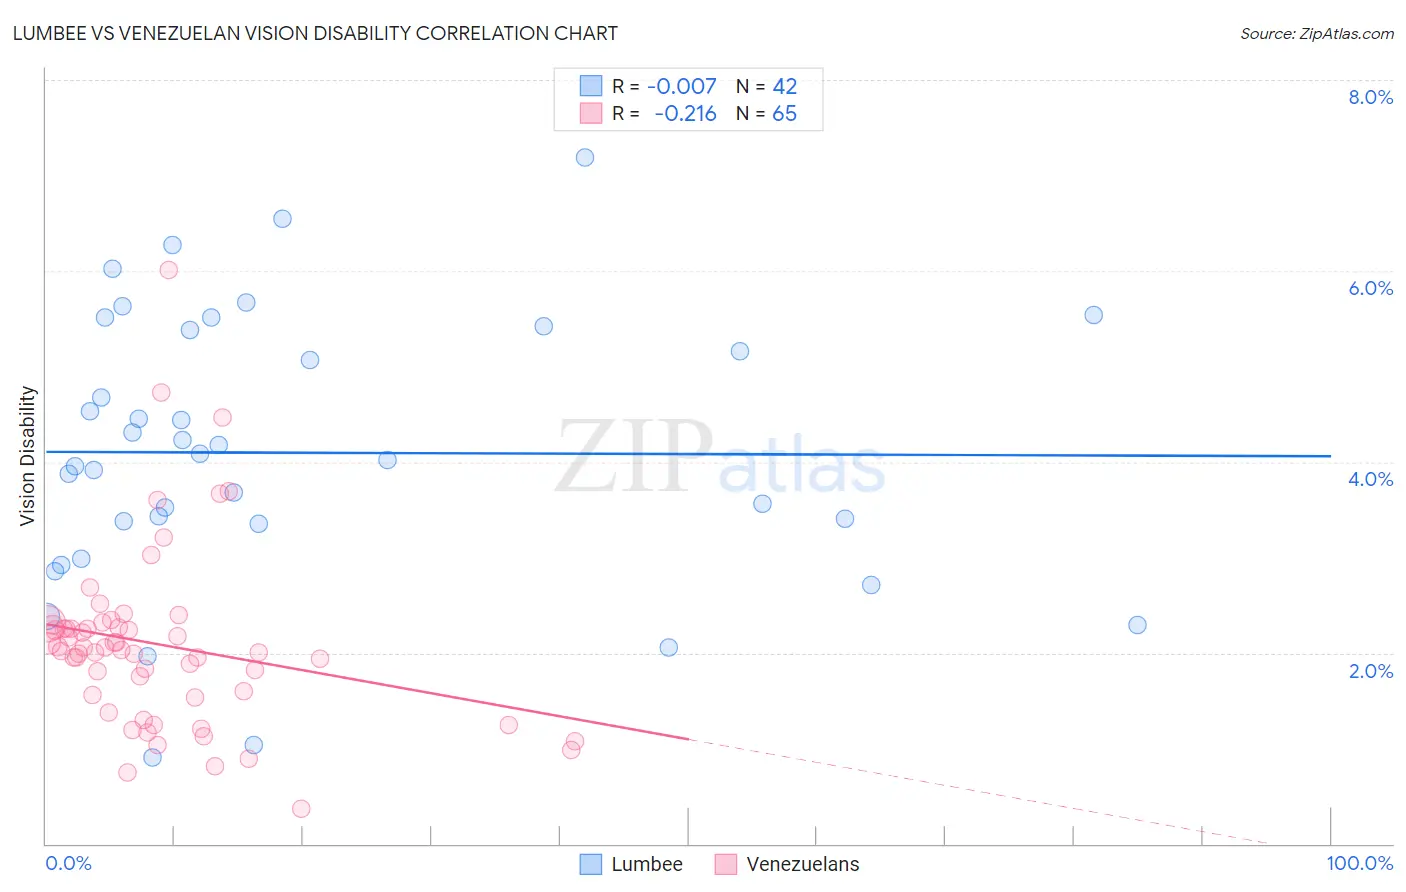
Lumbee vs Venezuelan Vision Disability Correlation Chart
The statistical analysis conducted on geographies consisting of 92,245,889 people shows no correlation between the proportion of Lumbee and percentage of population with vision disability in the United States with a correlation coefficient (R) of -0.007 and weighted average of 3.4%. Similarly, the statistical analysis conducted on geographies consisting of 306,200,633 people shows a weak negative correlation between the proportion of Venezuelans and percentage of population with vision disability in the United States with a correlation coefficient (R) of -0.216 and weighted average of 2.1%, a difference of 61.1%.
Vision Disability Correlation Summary
| Measurement | Lumbee | Venezuelan |
| Minimum | 0.90% | 0.36% |
| Maximum | 7.2% | 6.0% |
| Range | 6.3% | 5.6% |
| Mean | 4.1% | 2.1% |
| Median | 4.1% | 2.0% |
| Interquartile 25% (IQ1) | 3.4% | 1.5% |
| Interquartile 75% (IQ3) | 5.4% | 2.3% |
| Interquartile Range (IQR) | 2.0% | 0.73% |
| Standard Deviation (Sample) | 1.4% | 0.94% |
| Standard Deviation (Population) | 1.4% | 0.94% |
Similar Demographics by Vision Disability
Demographics Similar to Lumbee by Vision Disability
In terms of vision disability, the demographic groups most similar to Lumbee are Pueblo (3.3%, a difference of 1.6%), Pima (3.3%, a difference of 1.6%), Houma (3.4%, a difference of 1.7%), Choctaw (3.3%, a difference of 2.7%), and Kiowa (3.3%, a difference of 4.1%).
| Demographics | Rating | Rank | Vision Disability |
| Cajuns | 0.0 /100 | #333 | Tragic 3.1% |
| Cheyenne | 0.0 /100 | #334 | Tragic 3.1% |
| Navajo | 0.0 /100 | #335 | Tragic 3.1% |
| Alaskan Athabascans | 0.0 /100 | #336 | Tragic 3.1% |
| Dutch West Indians | 0.0 /100 | #337 | Tragic 3.2% |
| Chickasaw | 0.0 /100 | #338 | Tragic 3.2% |
| Tsimshian | 0.0 /100 | #339 | Tragic 3.2% |
| Creek | 0.0 /100 | #340 | Tragic 3.2% |
| Kiowa | 0.0 /100 | #341 | Tragic 3.3% |
| Choctaw | 0.0 /100 | #342 | Tragic 3.3% |
| Pima | 0.0 /100 | #343 | Tragic 3.3% |
| Pueblo | 0.0 /100 | #344 | Tragic 3.3% |
| Lumbee | 0.0 /100 | #345 | Tragic 3.4% |
| Houma | 0.0 /100 | #346 | Tragic 3.4% |
| Puerto Ricans | 0.0 /100 | #347 | Tragic 3.9% |
Demographics Similar to Venezuelans by Vision Disability
In terms of vision disability, the demographic groups most similar to Venezuelans are Syrian (2.1%, a difference of 0.050%), Vietnamese (2.1%, a difference of 0.070%), Czech (2.1%, a difference of 0.12%), Immigrants from South Eastern Asia (2.1%, a difference of 0.12%), and Arab (2.1%, a difference of 0.13%).
| Demographics | Rating | Rank | Vision Disability |
| Sudanese | 89.2 /100 | #127 | Excellent 2.1% |
| Immigrants | Chile | 89.0 /100 | #128 | Excellent 2.1% |
| Immigrants | Cameroon | 88.8 /100 | #129 | Excellent 2.1% |
| Immigrants | Kenya | 88.7 /100 | #130 | Excellent 2.1% |
| Immigrants | Hungary | 88.7 /100 | #131 | Excellent 2.1% |
| New Zealanders | 88.2 /100 | #132 | Excellent 2.1% |
| Syrians | 87.5 /100 | #133 | Excellent 2.1% |
| Venezuelans | 87.2 /100 | #134 | Excellent 2.1% |
| Vietnamese | 86.7 /100 | #135 | Excellent 2.1% |
| Czechs | 86.3 /100 | #136 | Excellent 2.1% |
| Immigrants | South Eastern Asia | 86.3 /100 | #137 | Excellent 2.1% |
| Arabs | 86.3 /100 | #138 | Excellent 2.1% |
| Immigrants | Morocco | 85.2 /100 | #139 | Excellent 2.1% |
| Immigrants | Netherlands | 84.2 /100 | #140 | Excellent 2.1% |
| Sierra Leoneans | 84.1 /100 | #141 | Excellent 2.1% |