Lumbee vs Venezuelan In Labor Force | Age 30-34
COMPARE
Lumbee
Venezuelan
In Labor Force | Age 30-34
In Labor Force | Age 30-34 Comparison
Lumbee
Venezuelans
77.3%
IN LABOR FORCE | AGE 30-34
0.0/ 100
METRIC RATING
343rd/ 347
METRIC RANK
84.0%
IN LABOR FORCE | AGE 30-34
1.3/ 100
METRIC RATING
240th/ 347
METRIC RANK
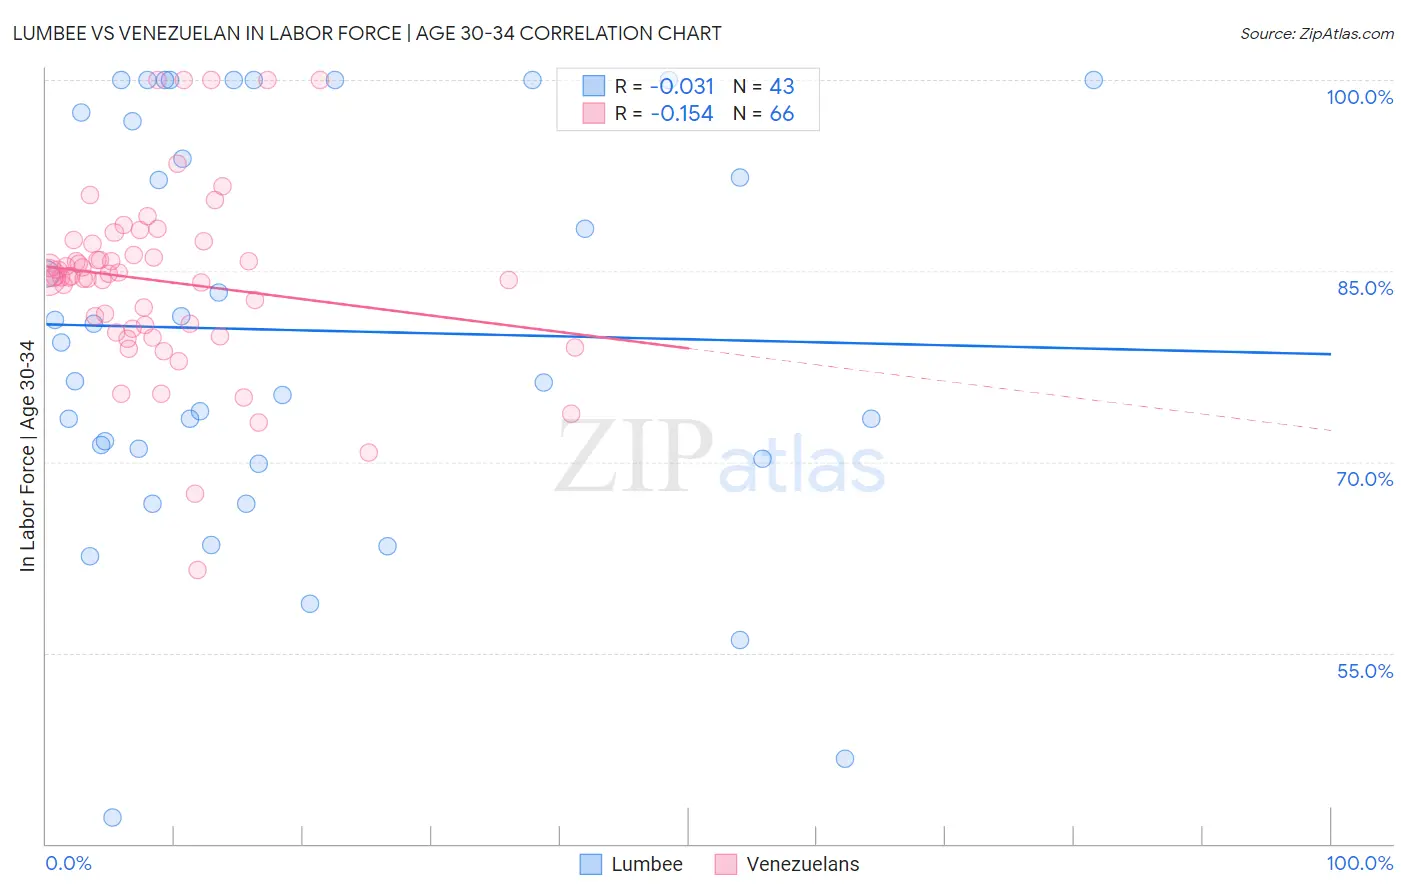
Lumbee vs Venezuelan In Labor Force | Age 30-34 Correlation Chart
The statistical analysis conducted on geographies consisting of 92,256,461 people shows no correlation between the proportion of Lumbee and labor force participation rate among population between the ages 30 and 34 in the United States with a correlation coefficient (R) of -0.031 and weighted average of 77.3%. Similarly, the statistical analysis conducted on geographies consisting of 306,199,344 people shows a poor negative correlation between the proportion of Venezuelans and labor force participation rate among population between the ages 30 and 34 in the United States with a correlation coefficient (R) of -0.154 and weighted average of 84.0%, a difference of 8.8%.
In Labor Force | Age 30-34 Correlation Summary
| Measurement | Lumbee | Venezuelan |
| Minimum | 42.1% | 61.5% |
| Maximum | 100.0% | 100.0% |
| Range | 57.9% | 38.5% |
| Mean | 80.3% | 84.2% |
| Median | 79.4% | 84.5% |
| Interquartile 25% (IQ1) | 70.2% | 80.5% |
| Interquartile 75% (IQ3) | 97.5% | 87.1% |
| Interquartile Range (IQR) | 27.2% | 6.6% |
| Standard Deviation (Sample) | 15.9% | 7.2% |
| Standard Deviation (Population) | 15.7% | 7.1% |
Similar Demographics by In Labor Force | Age 30-34
Demographics Similar to Lumbee by In Labor Force | Age 30-34
In terms of in labor force | age 30-34, the demographic groups most similar to Lumbee are Yuman (77.1%, a difference of 0.23%), Tohono O'odham (77.7%, a difference of 0.60%), Yup'ik (76.4%, a difference of 1.1%), Immigrants from Yemen (78.2%, a difference of 1.2%), and Crow (75.9%, a difference of 1.8%).
| Demographics | Rating | Rank | In Labor Force | Age 30-34 |
| Inupiat | 0.0 /100 | #333 | Tragic 79.7% |
| Hopi | 0.0 /100 | #334 | Tragic 79.3% |
| Marshallese | 0.0 /100 | #335 | Tragic 79.2% |
| Natives/Alaskans | 0.0 /100 | #336 | Tragic 79.2% |
| Yakama | 0.0 /100 | #337 | Tragic 79.1% |
| Pima | 0.0 /100 | #338 | Tragic 79.0% |
| Apache | 0.0 /100 | #339 | Tragic 79.0% |
| Ute | 0.0 /100 | #340 | Tragic 78.9% |
| Immigrants | Yemen | 0.0 /100 | #341 | Tragic 78.2% |
| Tohono O'odham | 0.0 /100 | #342 | Tragic 77.7% |
| Lumbee | 0.0 /100 | #343 | Tragic 77.3% |
| Yuman | 0.0 /100 | #344 | Tragic 77.1% |
| Yup'ik | 0.0 /100 | #345 | Tragic 76.4% |
| Crow | 0.0 /100 | #346 | Tragic 75.9% |
| Navajo | 0.0 /100 | #347 | Tragic 73.8% |
Demographics Similar to Venezuelans by In Labor Force | Age 30-34
In terms of in labor force | age 30-34, the demographic groups most similar to Venezuelans are English (84.0%, a difference of 0.0%), Celtic (84.1%, a difference of 0.010%), Immigrants from Barbados (84.0%, a difference of 0.010%), U.S. Virgin Islander (84.1%, a difference of 0.020%), and Immigrants from Portugal (84.0%, a difference of 0.020%).
| Demographics | Rating | Rank | In Labor Force | Age 30-34 |
| West Indians | 1.9 /100 | #233 | Tragic 84.1% |
| Haitians | 1.8 /100 | #234 | Tragic 84.1% |
| French American Indians | 1.7 /100 | #235 | Tragic 84.1% |
| U.S. Virgin Islanders | 1.5 /100 | #236 | Tragic 84.1% |
| Celtics | 1.4 /100 | #237 | Tragic 84.1% |
| Immigrants | Barbados | 1.4 /100 | #238 | Tragic 84.0% |
| English | 1.4 /100 | #239 | Tragic 84.0% |
| Venezuelans | 1.3 /100 | #240 | Tragic 84.0% |
| Immigrants | Portugal | 1.2 /100 | #241 | Tragic 84.0% |
| Immigrants | Oceania | 1.1 /100 | #242 | Tragic 84.0% |
| Immigrants | Caribbean | 1.1 /100 | #243 | Tragic 84.0% |
| Basques | 0.9 /100 | #244 | Tragic 84.0% |
| Immigrants | Venezuela | 0.9 /100 | #245 | Tragic 84.0% |
| Central Americans | 0.9 /100 | #246 | Tragic 84.0% |
| British West Indians | 0.8 /100 | #247 | Tragic 84.0% |