Immigrants from Romania vs Venezuelan Associate's Degree
COMPARE
Immigrants from Romania
Venezuelan
Associate's Degree
Associate's Degree Comparison
Immigrants from Romania
Venezuelans
50.9%
ASSOCIATE'S DEGREE
99.5/ 100
METRIC RATING
71st/ 347
METRIC RANK
49.4%
ASSOCIATE'S DEGREE
97.0/ 100
METRIC RATING
104th/ 347
METRIC RANK
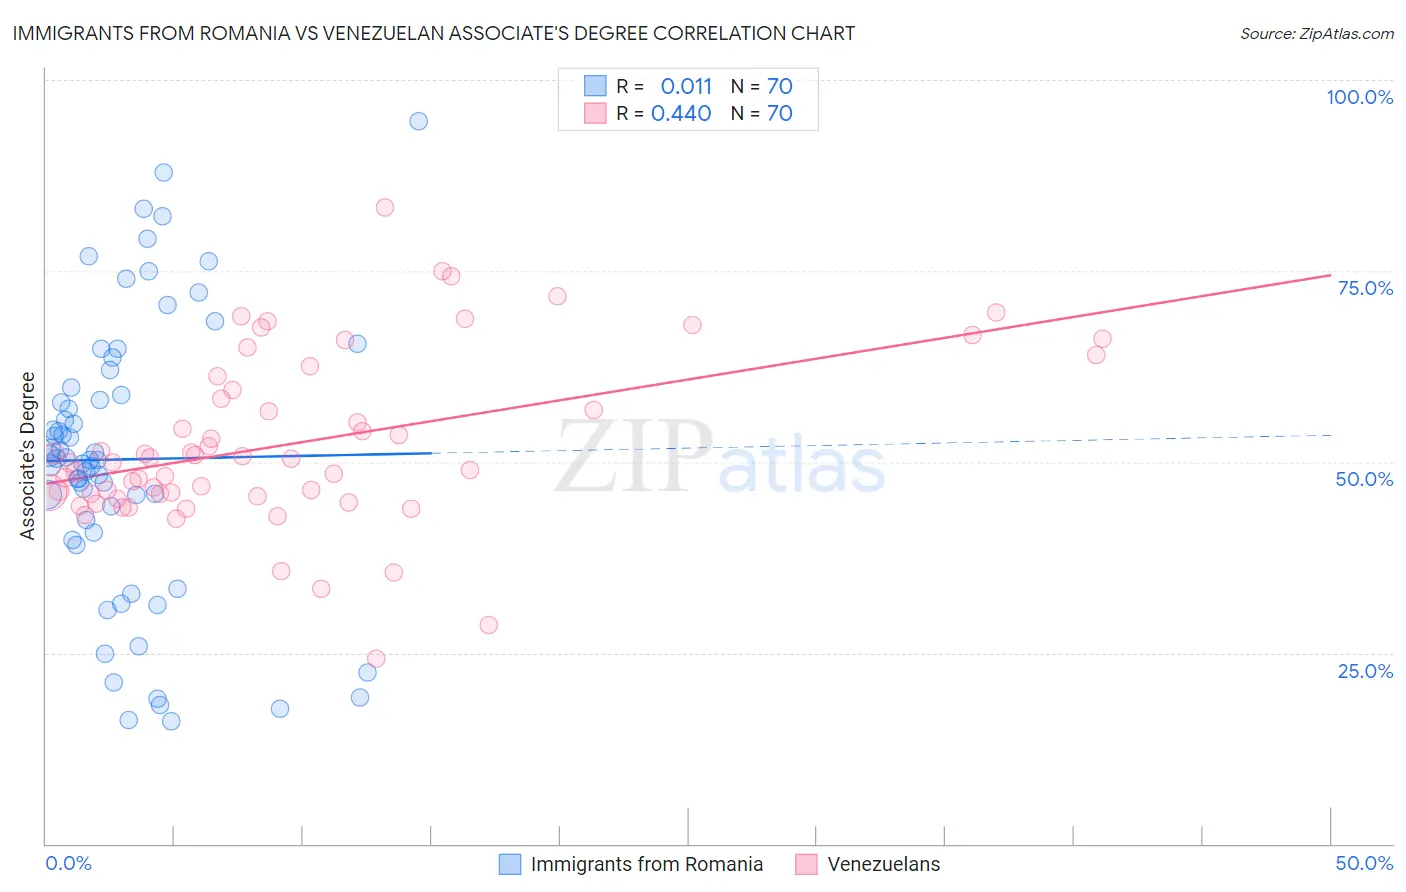
Immigrants from Romania vs Venezuelan Associate's Degree Correlation Chart
The statistical analysis conducted on geographies consisting of 257,014,107 people shows no correlation between the proportion of Immigrants from Romania and percentage of population with at least associate's degree education in the United States with a correlation coefficient (R) of 0.011 and weighted average of 50.9%. Similarly, the statistical analysis conducted on geographies consisting of 306,307,372 people shows a moderate positive correlation between the proportion of Venezuelans and percentage of population with at least associate's degree education in the United States with a correlation coefficient (R) of 0.440 and weighted average of 49.4%, a difference of 3.1%.
Associate's Degree Correlation Summary
| Measurement | Immigrants from Romania | Venezuelan |
| Minimum | 16.1% | 24.3% |
| Maximum | 94.5% | 83.4% |
| Range | 78.4% | 59.1% |
| Mean | 50.3% | 52.4% |
| Median | 50.3% | 50.1% |
| Interquartile 25% (IQ1) | 40.7% | 45.8% |
| Interquartile 75% (IQ3) | 59.7% | 59.4% |
| Interquartile Range (IQR) | 19.1% | 13.7% |
| Standard Deviation (Sample) | 18.2% | 11.2% |
| Standard Deviation (Population) | 18.1% | 11.1% |
Similar Demographics by Associate's Degree
Demographics Similar to Immigrants from Romania by Associate's Degree
In terms of associate's degree, the demographic groups most similar to Immigrants from Romania are Immigrants from Argentina (50.9%, a difference of 0.010%), Egyptian (50.9%, a difference of 0.040%), Immigrants from Pakistan (50.9%, a difference of 0.060%), Immigrants from Indonesia (51.0%, a difference of 0.16%), and Carpatho Rusyn (50.6%, a difference of 0.53%).
| Demographics | Rating | Rank | Associate's Degree |
| Immigrants | Netherlands | 99.7 /100 | #64 | Exceptional 51.4% |
| Zimbabweans | 99.7 /100 | #65 | Exceptional 51.3% |
| Immigrants | Europe | 99.7 /100 | #66 | Exceptional 51.3% |
| Argentineans | 99.6 /100 | #67 | Exceptional 51.2% |
| Immigrants | Indonesia | 99.5 /100 | #68 | Exceptional 51.0% |
| Egyptians | 99.5 /100 | #69 | Exceptional 50.9% |
| Immigrants | Argentina | 99.5 /100 | #70 | Exceptional 50.9% |
| Immigrants | Romania | 99.5 /100 | #71 | Exceptional 50.9% |
| Immigrants | Pakistan | 99.5 /100 | #72 | Exceptional 50.9% |
| Carpatho Rusyns | 99.3 /100 | #73 | Exceptional 50.6% |
| Lithuanians | 99.3 /100 | #74 | Exceptional 50.6% |
| Immigrants | Scotland | 99.3 /100 | #75 | Exceptional 50.6% |
| Immigrants | Zimbabwe | 99.2 /100 | #76 | Exceptional 50.5% |
| Immigrants | Lebanon | 99.1 /100 | #77 | Exceptional 50.5% |
| Immigrants | Eastern Europe | 99.1 /100 | #78 | Exceptional 50.5% |
Demographics Similar to Venezuelans by Associate's Degree
In terms of associate's degree, the demographic groups most similar to Venezuelans are Ukrainian (49.4%, a difference of 0.060%), Croatian (49.3%, a difference of 0.15%), Immigrants from Italy (49.3%, a difference of 0.15%), Chilean (49.4%, a difference of 0.17%), and Syrian (49.3%, a difference of 0.18%).
| Demographics | Rating | Rank | Associate's Degree |
| Immigrants | Ukraine | 98.0 /100 | #97 | Exceptional 49.7% |
| Immigrants | Northern Africa | 97.9 /100 | #98 | Exceptional 49.7% |
| Macedonians | 97.8 /100 | #99 | Exceptional 49.6% |
| Immigrants | Nepal | 97.5 /100 | #100 | Exceptional 49.5% |
| Northern Europeans | 97.3 /100 | #101 | Exceptional 49.5% |
| Chileans | 97.3 /100 | #102 | Exceptional 49.4% |
| Ukrainians | 97.1 /100 | #103 | Exceptional 49.4% |
| Venezuelans | 97.0 /100 | #104 | Exceptional 49.4% |
| Croatians | 96.8 /100 | #105 | Exceptional 49.3% |
| Immigrants | Italy | 96.7 /100 | #106 | Exceptional 49.3% |
| Syrians | 96.7 /100 | #107 | Exceptional 49.3% |
| Jordanians | 96.6 /100 | #108 | Exceptional 49.2% |
| Immigrants | Morocco | 96.3 /100 | #109 | Exceptional 49.2% |
| Austrians | 95.8 /100 | #110 | Exceptional 49.1% |
| Immigrants | Venezuela | 95.8 /100 | #111 | Exceptional 49.1% |