Lumbee vs Immigrants from Trinidad and Tobago Unemployment Among Ages 20 to 24 years
COMPARE
Lumbee
Immigrants from Trinidad and Tobago
Unemployment Among Ages 20 to 24 years
Unemployment Among Ages 20 to 24 years Comparison
Lumbee
Immigrants from Trinidad and Tobago
12.0%
UNEMPLOYMENT AMONG AGES 20 TO 24 YEARS
0.0/ 100
METRIC RATING
298th/ 347
METRIC RANK
12.8%
UNEMPLOYMENT AMONG AGES 20 TO 24 YEARS
0.0/ 100
METRIC RATING
317th/ 347
METRIC RANK
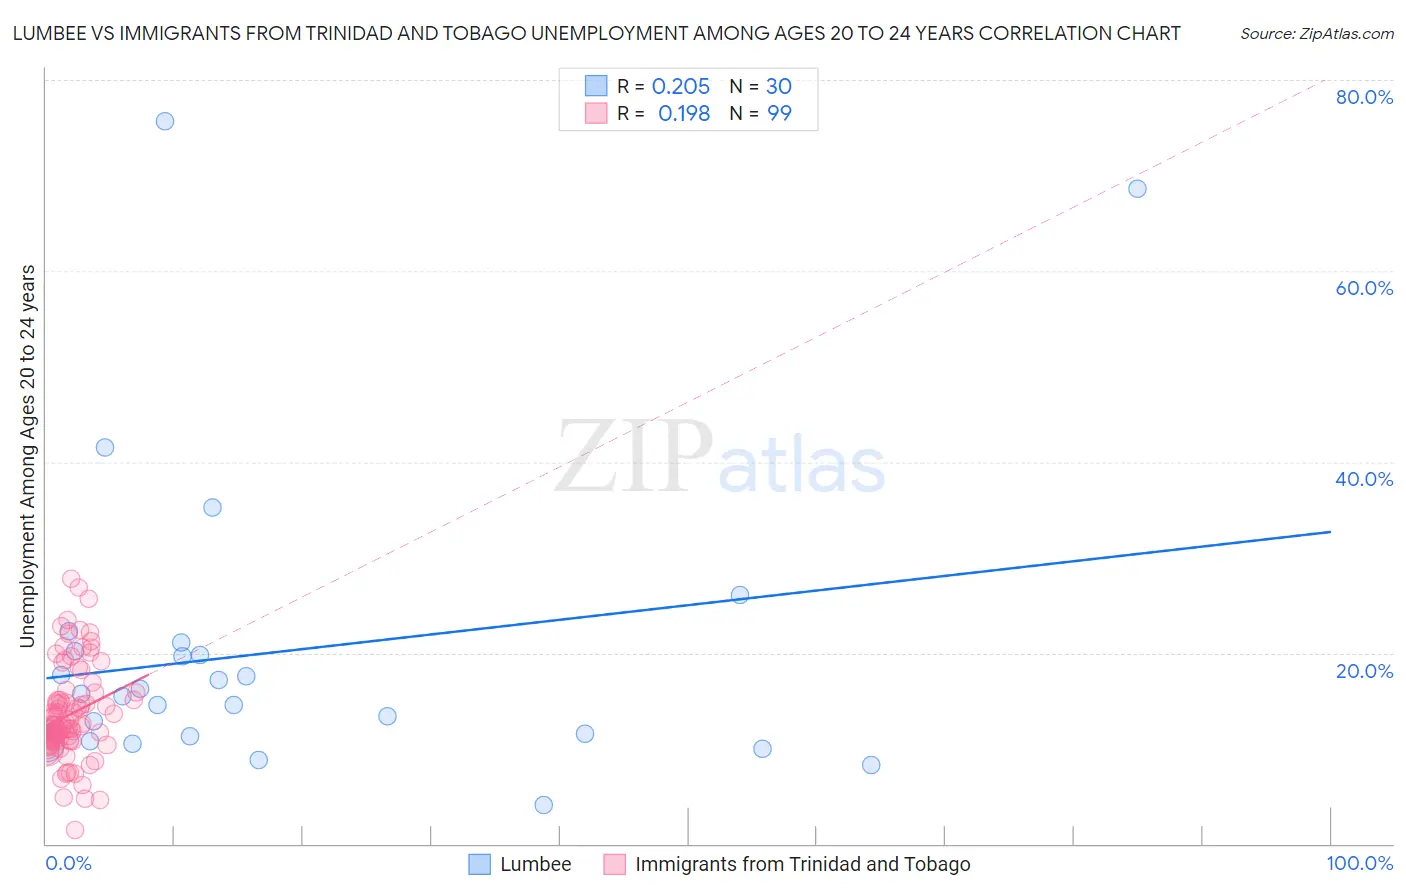
Lumbee vs Immigrants from Trinidad and Tobago Unemployment Among Ages 20 to 24 years Correlation Chart
The statistical analysis conducted on geographies consisting of 91,069,259 people shows a weak positive correlation between the proportion of Lumbee and unemployment rate among population between the ages 20 and 24 in the United States with a correlation coefficient (R) of 0.205 and weighted average of 12.0%. Similarly, the statistical analysis conducted on geographies consisting of 220,132,241 people shows a poor positive correlation between the proportion of Immigrants from Trinidad and Tobago and unemployment rate among population between the ages 20 and 24 in the United States with a correlation coefficient (R) of 0.198 and weighted average of 12.8%, a difference of 6.7%.
Unemployment Among Ages 20 to 24 years Correlation Summary
| Measurement | Lumbee | Immigrants from Trinidad and Tobago |
| Minimum | 4.0% | 1.4% |
| Maximum | 75.7% | 27.7% |
| Range | 71.7% | 26.3% |
| Mean | 20.1% | 13.6% |
| Median | 15.5% | 12.4% |
| Interquartile 25% (IQ1) | 11.3% | 10.7% |
| Interquartile 75% (IQ3) | 20.2% | 15.1% |
| Interquartile Range (IQR) | 8.9% | 4.3% |
| Standard Deviation (Sample) | 16.1% | 4.9% |
| Standard Deviation (Population) | 15.8% | 4.9% |
Demographics Similar to Lumbee and Immigrants from Trinidad and Tobago by Unemployment Among Ages 20 to 24 years
In terms of unemployment among ages 20 to 24 years, the demographic groups most similar to Lumbee are Apache (12.0%, a difference of 0.030%), Spanish American Indian (12.1%, a difference of 0.19%), Blackfeet (12.0%, a difference of 0.45%), Immigrants from Sierra Leone (12.1%, a difference of 0.67%), and Immigrants from Cabo Verde (12.2%, a difference of 1.5%). Similarly, the demographic groups most similar to Immigrants from Trinidad and Tobago are Immigrants from Dominica (12.8%, a difference of 0.12%), West Indian (12.8%, a difference of 0.60%), Black/African American (12.7%, a difference of 0.80%), Shoshone (12.7%, a difference of 1.0%), and Houma (12.6%, a difference of 1.5%).
| Demographics | Rating | Rank | Unemployment Among Ages 20 to 24 years |
| Blackfeet | 0.0 /100 | #297 | Tragic 12.0% |
| Lumbee | 0.0 /100 | #298 | Tragic 12.0% |
| Apache | 0.0 /100 | #299 | Tragic 12.0% |
| Spanish American Indians | 0.0 /100 | #300 | Tragic 12.1% |
| Immigrants | Sierra Leone | 0.0 /100 | #301 | Tragic 12.1% |
| Immigrants | Cabo Verde | 0.0 /100 | #302 | Tragic 12.2% |
| Haitians | 0.0 /100 | #303 | Tragic 12.2% |
| Immigrants | West Indies | 0.0 /100 | #304 | Tragic 12.3% |
| Chippewa | 0.0 /100 | #305 | Tragic 12.3% |
| Immigrants | Haiti | 0.0 /100 | #306 | Tragic 12.4% |
| Bermudans | 0.0 /100 | #307 | Tragic 12.5% |
| Tohono O'odham | 0.0 /100 | #308 | Tragic 12.5% |
| Immigrants | Bangladesh | 0.0 /100 | #309 | Tragic 12.6% |
| Jamaicans | 0.0 /100 | #310 | Tragic 12.6% |
| Vietnamese | 0.0 /100 | #311 | Tragic 12.6% |
| Houma | 0.0 /100 | #312 | Tragic 12.6% |
| Shoshone | 0.0 /100 | #313 | Tragic 12.7% |
| Blacks/African Americans | 0.0 /100 | #314 | Tragic 12.7% |
| West Indians | 0.0 /100 | #315 | Tragic 12.8% |
| Immigrants | Dominica | 0.0 /100 | #316 | Tragic 12.8% |
| Immigrants | Trinidad and Tobago | 0.0 /100 | #317 | Tragic 12.8% |