Lumbee vs Asian Bachelor's Degree
COMPARE
Lumbee
Asian
Bachelor's Degree
Bachelor's Degree Comparison
Lumbee
Asians
24.8%
BACHELOR'S DEGREE
0.0/ 100
METRIC RATING
340th/ 347
METRIC RANK
44.4%
BACHELOR'S DEGREE
99.9/ 100
METRIC RATING
51st/ 347
METRIC RANK
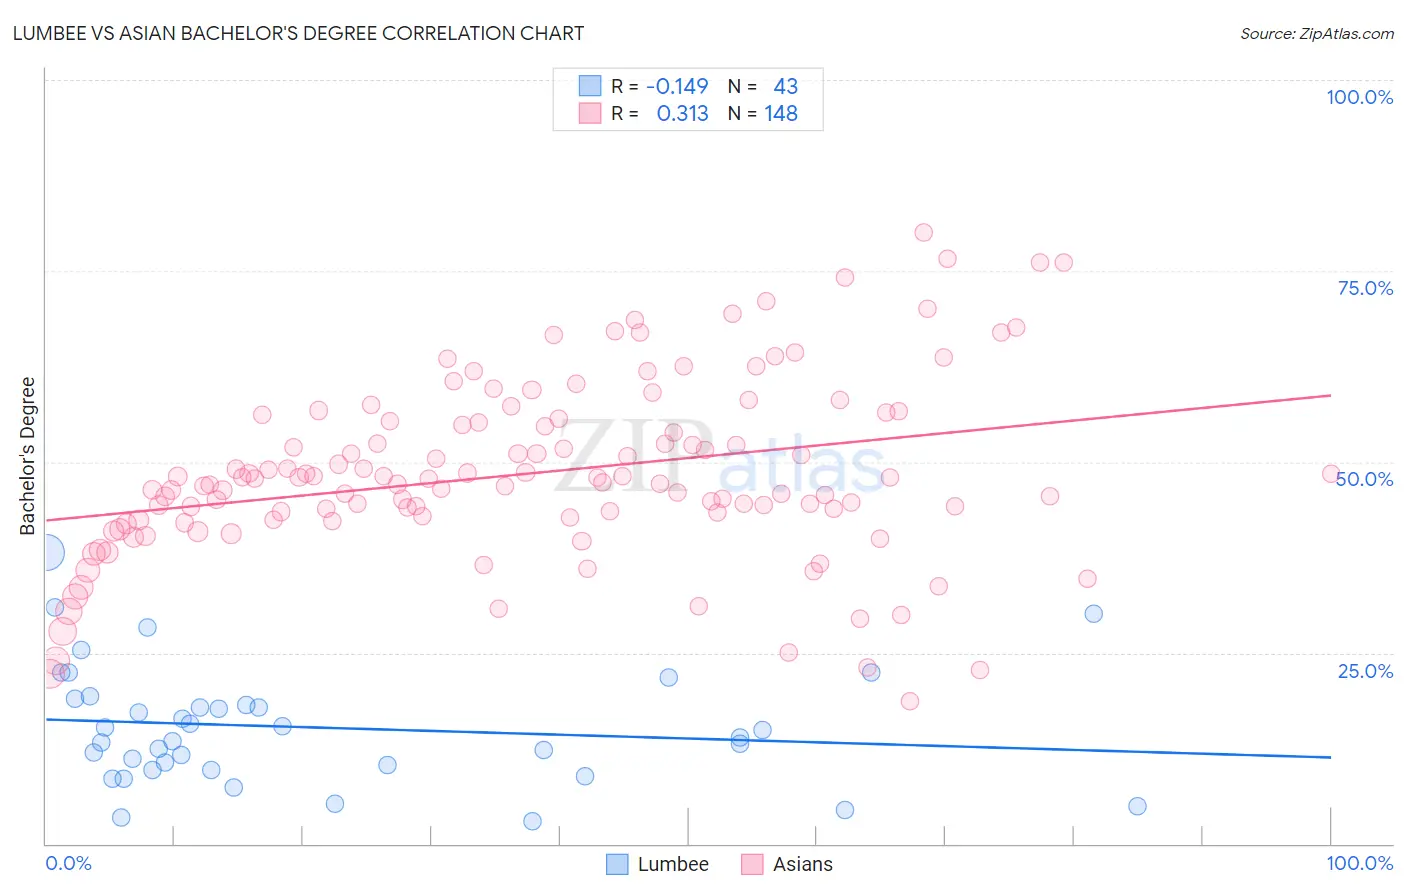
Lumbee vs Asian Bachelor's Degree Correlation Chart
The statistical analysis conducted on geographies consisting of 92,297,287 people shows a poor negative correlation between the proportion of Lumbee and percentage of population with at least bachelor's degree education in the United States with a correlation coefficient (R) of -0.149 and weighted average of 24.8%. Similarly, the statistical analysis conducted on geographies consisting of 550,793,799 people shows a mild positive correlation between the proportion of Asians and percentage of population with at least bachelor's degree education in the United States with a correlation coefficient (R) of 0.313 and weighted average of 44.4%, a difference of 79.3%.
Bachelor's Degree Correlation Summary
| Measurement | Lumbee | Asian |
| Minimum | 2.9% | 18.6% |
| Maximum | 38.2% | 80.1% |
| Range | 35.2% | 61.5% |
| Mean | 15.2% | 48.5% |
| Median | 13.9% | 47.5% |
| Interquartile 25% (IQ1) | 9.7% | 42.5% |
| Interquartile 75% (IQ3) | 19.0% | 55.2% |
| Interquartile Range (IQR) | 9.2% | 12.7% |
| Standard Deviation (Sample) | 7.7% | 11.7% |
| Standard Deviation (Population) | 7.6% | 11.7% |
Similar Demographics by Bachelor's Degree
Demographics Similar to Lumbee by Bachelor's Degree
In terms of bachelor's degree, the demographic groups most similar to Lumbee are Yuman (24.5%, a difference of 0.92%), Yakama (24.5%, a difference of 1.2%), Tohono O'odham (24.4%, a difference of 1.4%), Hopi (25.3%, a difference of 2.2%), and Pueblo (25.5%, a difference of 3.2%).
| Demographics | Rating | Rank | Bachelor's Degree |
| Mexicans | 0.0 /100 | #333 | Tragic 27.1% |
| Arapaho | 0.0 /100 | #334 | Tragic 26.6% |
| Natives/Alaskans | 0.0 /100 | #335 | Tragic 26.3% |
| Immigrants | Mexico | 0.0 /100 | #336 | Tragic 26.1% |
| Inupiat | 0.0 /100 | #337 | Tragic 25.8% |
| Pueblo | 0.0 /100 | #338 | Tragic 25.5% |
| Hopi | 0.0 /100 | #339 | Tragic 25.3% |
| Lumbee | 0.0 /100 | #340 | Tragic 24.8% |
| Yuman | 0.0 /100 | #341 | Tragic 24.5% |
| Yakama | 0.0 /100 | #342 | Tragic 24.5% |
| Tohono O'odham | 0.0 /100 | #343 | Tragic 24.4% |
| Navajo | 0.0 /100 | #344 | Tragic 23.6% |
| Pima | 0.0 /100 | #345 | Tragic 23.2% |
| Houma | 0.0 /100 | #346 | Tragic 21.4% |
| Yup'ik | 0.0 /100 | #347 | Tragic 19.4% |
Demographics Similar to Asians by Bachelor's Degree
In terms of bachelor's degree, the demographic groups most similar to Asians are Immigrants from Greece (44.5%, a difference of 0.14%), Immigrants from Spain (44.3%, a difference of 0.18%), Immigrants from Asia (44.3%, a difference of 0.24%), Immigrants from Norway (44.5%, a difference of 0.25%), and Bolivian (44.6%, a difference of 0.38%).
| Demographics | Rating | Rank | Bachelor's Degree |
| Immigrants | Lithuania | 99.9 /100 | #44 | Exceptional 44.6% |
| Immigrants | Kuwait | 99.9 /100 | #45 | Exceptional 44.6% |
| Immigrants | Bulgaria | 99.9 /100 | #46 | Exceptional 44.6% |
| Bolivians | 99.9 /100 | #47 | Exceptional 44.6% |
| Estonians | 99.9 /100 | #48 | Exceptional 44.6% |
| Immigrants | Norway | 99.9 /100 | #49 | Exceptional 44.5% |
| Immigrants | Greece | 99.9 /100 | #50 | Exceptional 44.5% |
| Asians | 99.9 /100 | #51 | Exceptional 44.4% |
| Immigrants | Spain | 99.9 /100 | #52 | Exceptional 44.3% |
| Immigrants | Asia | 99.9 /100 | #53 | Exceptional 44.3% |
| Immigrants | Austria | 99.9 /100 | #54 | Exceptional 44.2% |
| Immigrants | Bolivia | 99.9 /100 | #55 | Exceptional 44.2% |
| Immigrants | Serbia | 99.9 /100 | #56 | Exceptional 44.1% |
| Paraguayans | 99.9 /100 | #57 | Exceptional 44.0% |
| Immigrants | Czechoslovakia | 99.9 /100 | #58 | Exceptional 44.0% |