Lumbee vs Immigrants from Panama Bachelor's Degree
COMPARE
Lumbee
Immigrants from Panama
Bachelor's Degree
Bachelor's Degree Comparison
Lumbee
Immigrants from Panama
24.8%
BACHELOR'S DEGREE
0.0/ 100
METRIC RATING
340th/ 347
METRIC RANK
36.2%
BACHELOR'S DEGREE
14.2/ 100
METRIC RATING
213th/ 347
METRIC RANK
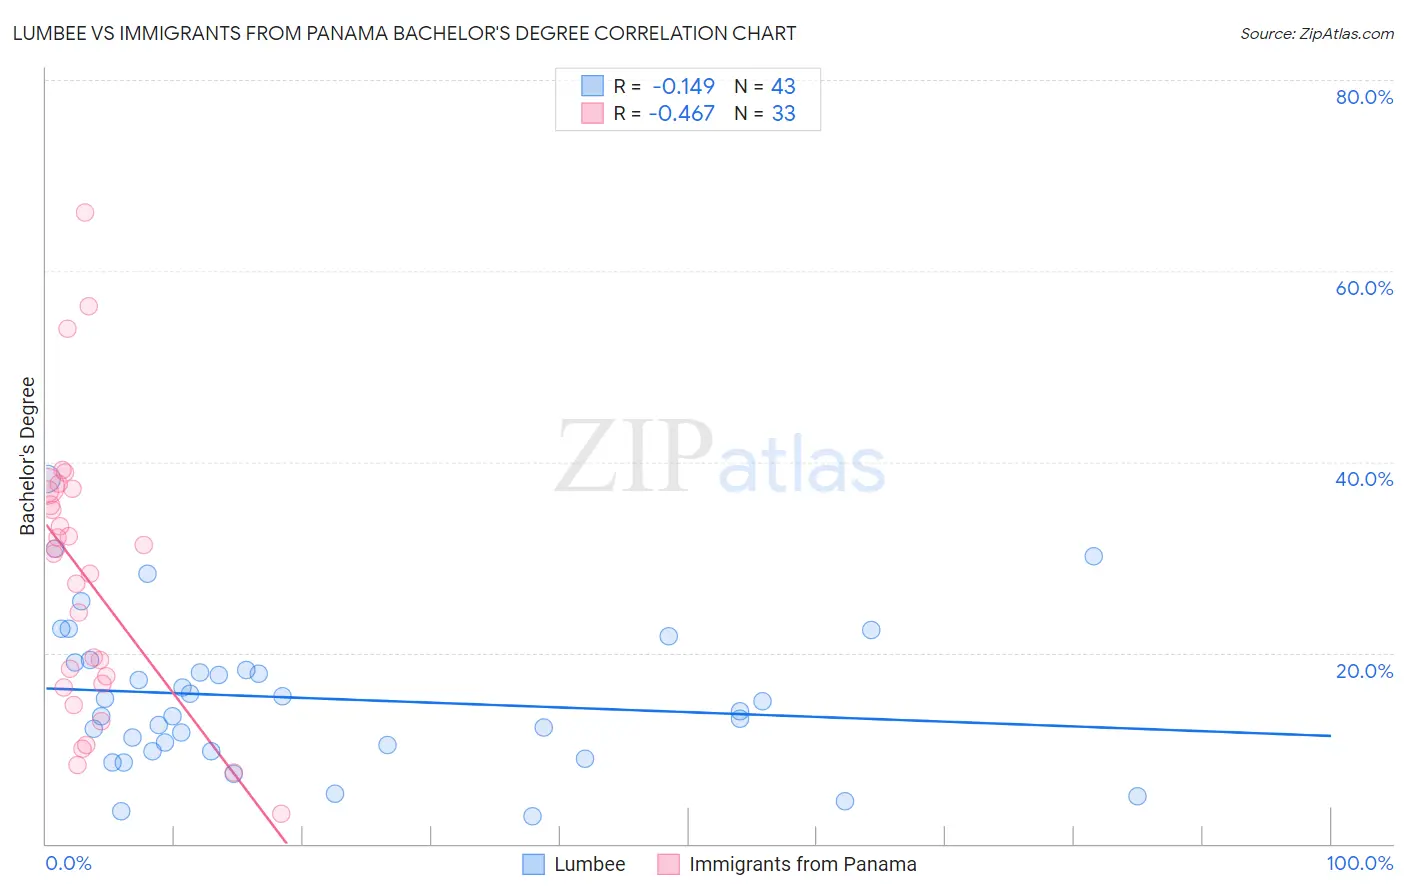
Lumbee vs Immigrants from Panama Bachelor's Degree Correlation Chart
The statistical analysis conducted on geographies consisting of 92,297,287 people shows a poor negative correlation between the proportion of Lumbee and percentage of population with at least bachelor's degree education in the United States with a correlation coefficient (R) of -0.149 and weighted average of 24.8%. Similarly, the statistical analysis conducted on geographies consisting of 221,180,522 people shows a moderate negative correlation between the proportion of Immigrants from Panama and percentage of population with at least bachelor's degree education in the United States with a correlation coefficient (R) of -0.467 and weighted average of 36.2%, a difference of 46.1%.
Bachelor's Degree Correlation Summary
| Measurement | Lumbee | Immigrants from Panama |
| Minimum | 2.9% | 3.2% |
| Maximum | 38.2% | 66.2% |
| Range | 35.2% | 63.0% |
| Mean | 15.2% | 27.8% |
| Median | 13.9% | 30.3% |
| Interquartile 25% (IQ1) | 9.7% | 16.6% |
| Interquartile 75% (IQ3) | 19.0% | 37.0% |
| Interquartile Range (IQR) | 9.2% | 20.5% |
| Standard Deviation (Sample) | 7.7% | 14.6% |
| Standard Deviation (Population) | 7.6% | 14.4% |
Similar Demographics by Bachelor's Degree
Demographics Similar to Lumbee by Bachelor's Degree
In terms of bachelor's degree, the demographic groups most similar to Lumbee are Yuman (24.5%, a difference of 0.92%), Yakama (24.5%, a difference of 1.2%), Tohono O'odham (24.4%, a difference of 1.4%), Hopi (25.3%, a difference of 2.2%), and Pueblo (25.5%, a difference of 3.2%).
| Demographics | Rating | Rank | Bachelor's Degree |
| Mexicans | 0.0 /100 | #333 | Tragic 27.1% |
| Arapaho | 0.0 /100 | #334 | Tragic 26.6% |
| Natives/Alaskans | 0.0 /100 | #335 | Tragic 26.3% |
| Immigrants | Mexico | 0.0 /100 | #336 | Tragic 26.1% |
| Inupiat | 0.0 /100 | #337 | Tragic 25.8% |
| Pueblo | 0.0 /100 | #338 | Tragic 25.5% |
| Hopi | 0.0 /100 | #339 | Tragic 25.3% |
| Lumbee | 0.0 /100 | #340 | Tragic 24.8% |
| Yuman | 0.0 /100 | #341 | Tragic 24.5% |
| Yakama | 0.0 /100 | #342 | Tragic 24.5% |
| Tohono O'odham | 0.0 /100 | #343 | Tragic 24.4% |
| Navajo | 0.0 /100 | #344 | Tragic 23.6% |
| Pima | 0.0 /100 | #345 | Tragic 23.2% |
| Houma | 0.0 /100 | #346 | Tragic 21.4% |
| Yup'ik | 0.0 /100 | #347 | Tragic 19.4% |
Demographics Similar to Immigrants from Panama by Bachelor's Degree
In terms of bachelor's degree, the demographic groups most similar to Immigrants from Panama are German (36.1%, a difference of 0.060%), Immigrants from Western Africa (36.1%, a difference of 0.10%), Barbadian (36.1%, a difference of 0.16%), Immigrants from Philippines (36.4%, a difference of 0.68%), and Scotch-Irish (36.4%, a difference of 0.76%).
| Demographics | Rating | Rank | Bachelor's Degree |
| Spaniards | 21.2 /100 | #206 | Fair 36.6% |
| Immigrants | Middle Africa | 20.6 /100 | #207 | Fair 36.6% |
| Immigrants | Thailand | 19.4 /100 | #208 | Poor 36.5% |
| Panamanians | 18.8 /100 | #209 | Poor 36.5% |
| French | 18.6 /100 | #210 | Poor 36.5% |
| Scotch-Irish | 18.3 /100 | #211 | Poor 36.4% |
| Immigrants | Philippines | 17.8 /100 | #212 | Poor 36.4% |
| Immigrants | Panama | 14.2 /100 | #213 | Poor 36.2% |
| Germans | 13.9 /100 | #214 | Poor 36.1% |
| Immigrants | Western Africa | 13.8 /100 | #215 | Poor 36.1% |
| Barbadians | 13.5 /100 | #216 | Poor 36.1% |
| German Russians | 10.2 /100 | #217 | Poor 35.8% |
| Sub-Saharan Africans | 9.8 /100 | #218 | Tragic 35.8% |
| West Indians | 9.7 /100 | #219 | Tragic 35.8% |
| Spanish | 9.6 /100 | #220 | Tragic 35.8% |