Lumbee vs Chippewa Bachelor's Degree
COMPARE
Lumbee
Chippewa
Bachelor's Degree
Bachelor's Degree Comparison
Lumbee
Chippewa
24.8%
BACHELOR'S DEGREE
0.0/ 100
METRIC RATING
340th/ 347
METRIC RANK
30.6%
BACHELOR'S DEGREE
0.0/ 100
METRIC RATING
298th/ 347
METRIC RANK
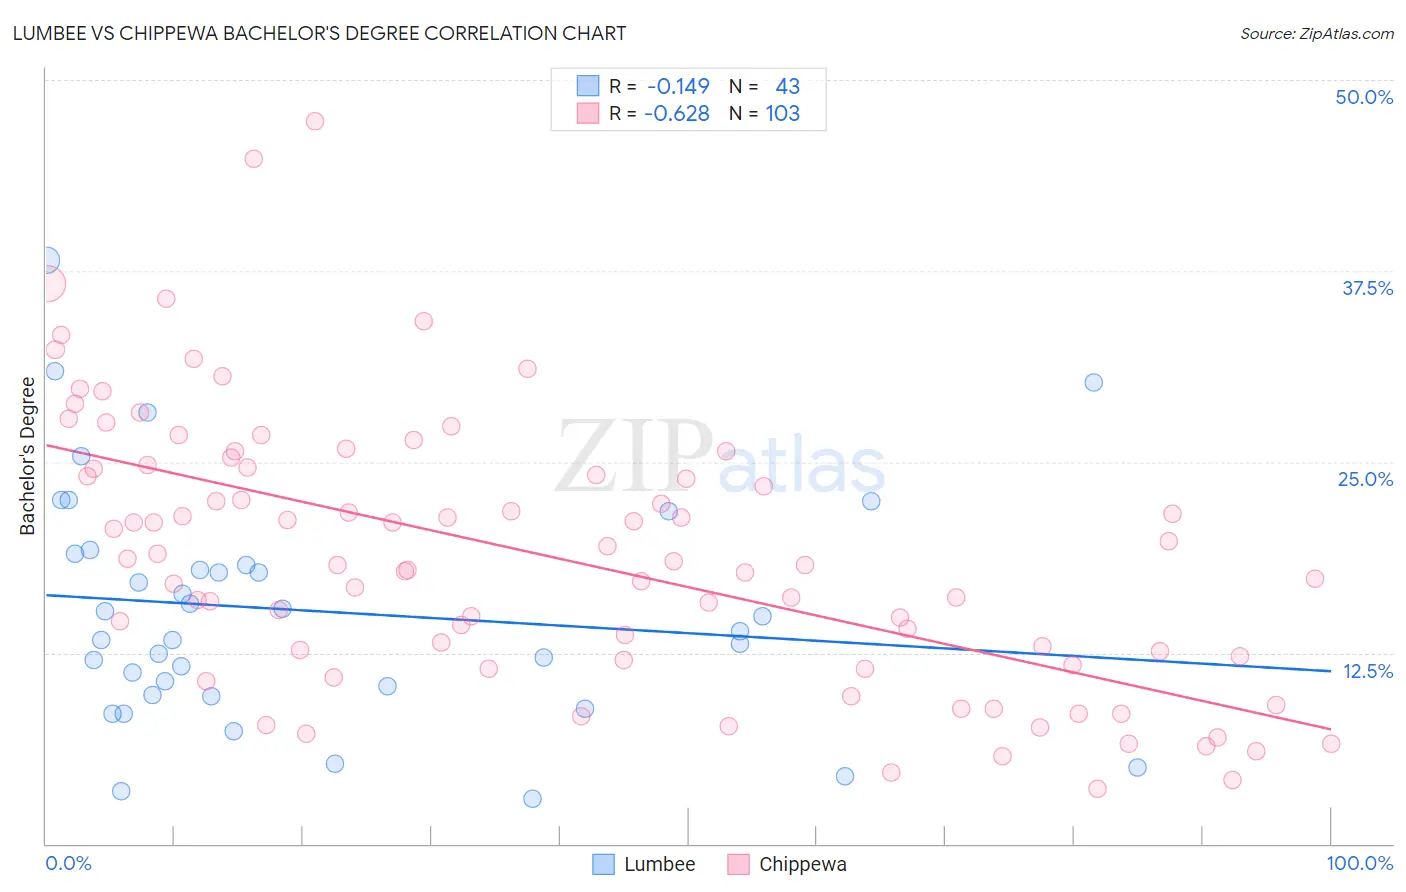
Lumbee vs Chippewa Bachelor's Degree Correlation Chart
The statistical analysis conducted on geographies consisting of 92,297,287 people shows a poor negative correlation between the proportion of Lumbee and percentage of population with at least bachelor's degree education in the United States with a correlation coefficient (R) of -0.149 and weighted average of 24.8%. Similarly, the statistical analysis conducted on geographies consisting of 215,055,774 people shows a significant negative correlation between the proportion of Chippewa and percentage of population with at least bachelor's degree education in the United States with a correlation coefficient (R) of -0.628 and weighted average of 30.6%, a difference of 23.4%.
Bachelor's Degree Correlation Summary
| Measurement | Lumbee | Chippewa |
| Minimum | 2.9% | 3.6% |
| Maximum | 38.2% | 47.3% |
| Range | 35.2% | 43.7% |
| Mean | 15.2% | 18.8% |
| Median | 13.9% | 18.2% |
| Interquartile 25% (IQ1) | 9.7% | 12.0% |
| Interquartile 75% (IQ3) | 19.0% | 24.6% |
| Interquartile Range (IQR) | 9.2% | 12.6% |
| Standard Deviation (Sample) | 7.7% | 8.9% |
| Standard Deviation (Population) | 7.6% | 8.8% |
Similar Demographics by Bachelor's Degree
Demographics Similar to Lumbee by Bachelor's Degree
In terms of bachelor's degree, the demographic groups most similar to Lumbee are Yuman (24.5%, a difference of 0.92%), Yakama (24.5%, a difference of 1.2%), Tohono O'odham (24.4%, a difference of 1.4%), Hopi (25.3%, a difference of 2.2%), and Pueblo (25.5%, a difference of 3.2%).
| Demographics | Rating | Rank | Bachelor's Degree |
| Mexicans | 0.0 /100 | #333 | Tragic 27.1% |
| Arapaho | 0.0 /100 | #334 | Tragic 26.6% |
| Natives/Alaskans | 0.0 /100 | #335 | Tragic 26.3% |
| Immigrants | Mexico | 0.0 /100 | #336 | Tragic 26.1% |
| Inupiat | 0.0 /100 | #337 | Tragic 25.8% |
| Pueblo | 0.0 /100 | #338 | Tragic 25.5% |
| Hopi | 0.0 /100 | #339 | Tragic 25.3% |
| Lumbee | 0.0 /100 | #340 | Tragic 24.8% |
| Yuman | 0.0 /100 | #341 | Tragic 24.5% |
| Yakama | 0.0 /100 | #342 | Tragic 24.5% |
| Tohono O'odham | 0.0 /100 | #343 | Tragic 24.4% |
| Navajo | 0.0 /100 | #344 | Tragic 23.6% |
| Pima | 0.0 /100 | #345 | Tragic 23.2% |
| Houma | 0.0 /100 | #346 | Tragic 21.4% |
| Yup'ik | 0.0 /100 | #347 | Tragic 19.4% |
Demographics Similar to Chippewa by Bachelor's Degree
In terms of bachelor's degree, the demographic groups most similar to Chippewa are Immigrants from Haiti (30.6%, a difference of 0.25%), Puget Sound Salish (30.7%, a difference of 0.31%), Immigrants from Dominican Republic (30.7%, a difference of 0.41%), Chickasaw (30.4%, a difference of 0.52%), and Immigrants from Micronesia (30.4%, a difference of 0.54%).
| Demographics | Rating | Rank | Bachelor's Degree |
| Blacks/African Americans | 0.1 /100 | #291 | Tragic 30.9% |
| Ute | 0.1 /100 | #292 | Tragic 30.9% |
| Cape Verdeans | 0.1 /100 | #293 | Tragic 30.9% |
| Immigrants | Guatemala | 0.0 /100 | #294 | Tragic 30.8% |
| Immigrants | Dominican Republic | 0.0 /100 | #295 | Tragic 30.7% |
| Puget Sound Salish | 0.0 /100 | #296 | Tragic 30.7% |
| Immigrants | Haiti | 0.0 /100 | #297 | Tragic 30.6% |
| Chippewa | 0.0 /100 | #298 | Tragic 30.6% |
| Chickasaw | 0.0 /100 | #299 | Tragic 30.4% |
| Immigrants | Micronesia | 0.0 /100 | #300 | Tragic 30.4% |
| Immigrants | Cuba | 0.0 /100 | #301 | Tragic 30.3% |
| Mexican American Indians | 0.0 /100 | #302 | Tragic 30.2% |
| Bangladeshis | 0.0 /100 | #303 | Tragic 30.2% |
| Cherokee | 0.0 /100 | #304 | Tragic 30.2% |
| Immigrants | Latin America | 0.0 /100 | #305 | Tragic 30.1% |