Lumbee vs Immigrants from Costa Rica Bachelor's Degree
COMPARE
Lumbee
Immigrants from Costa Rica
Bachelor's Degree
Bachelor's Degree Comparison
Lumbee
Immigrants from Costa Rica
24.8%
BACHELOR'S DEGREE
0.0/ 100
METRIC RATING
340th/ 347
METRIC RANK
36.9%
BACHELOR'S DEGREE
27.4/ 100
METRIC RATING
199th/ 347
METRIC RANK
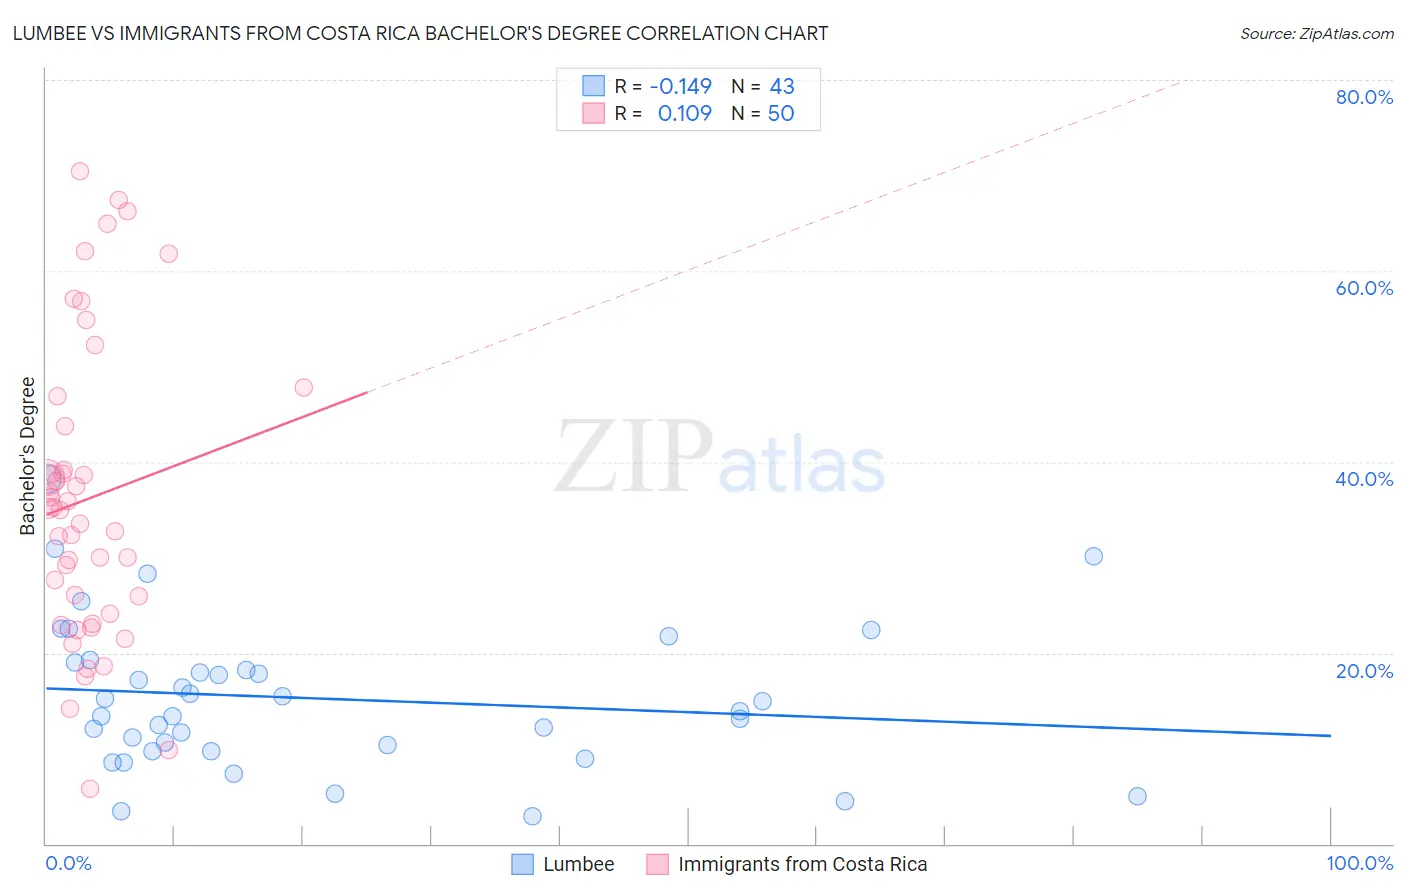
Lumbee vs Immigrants from Costa Rica Bachelor's Degree Correlation Chart
The statistical analysis conducted on geographies consisting of 92,297,287 people shows a poor negative correlation between the proportion of Lumbee and percentage of population with at least bachelor's degree education in the United States with a correlation coefficient (R) of -0.149 and weighted average of 24.8%. Similarly, the statistical analysis conducted on geographies consisting of 204,273,479 people shows a poor positive correlation between the proportion of Immigrants from Costa Rica and percentage of population with at least bachelor's degree education in the United States with a correlation coefficient (R) of 0.109 and weighted average of 36.9%, a difference of 49.2%.
Bachelor's Degree Correlation Summary
| Measurement | Lumbee | Immigrants from Costa Rica |
| Minimum | 2.9% | 5.7% |
| Maximum | 38.2% | 70.5% |
| Range | 35.2% | 64.7% |
| Mean | 15.2% | 36.1% |
| Median | 13.9% | 35.0% |
| Interquartile 25% (IQ1) | 9.7% | 24.1% |
| Interquartile 75% (IQ3) | 19.0% | 43.8% |
| Interquartile Range (IQR) | 9.2% | 19.7% |
| Standard Deviation (Sample) | 7.7% | 15.6% |
| Standard Deviation (Population) | 7.6% | 15.4% |
Similar Demographics by Bachelor's Degree
Demographics Similar to Lumbee by Bachelor's Degree
In terms of bachelor's degree, the demographic groups most similar to Lumbee are Yuman (24.5%, a difference of 0.92%), Yakama (24.5%, a difference of 1.2%), Tohono O'odham (24.4%, a difference of 1.4%), Hopi (25.3%, a difference of 2.2%), and Pueblo (25.5%, a difference of 3.2%).
| Demographics | Rating | Rank | Bachelor's Degree |
| Mexicans | 0.0 /100 | #333 | Tragic 27.1% |
| Arapaho | 0.0 /100 | #334 | Tragic 26.6% |
| Natives/Alaskans | 0.0 /100 | #335 | Tragic 26.3% |
| Immigrants | Mexico | 0.0 /100 | #336 | Tragic 26.1% |
| Inupiat | 0.0 /100 | #337 | Tragic 25.8% |
| Pueblo | 0.0 /100 | #338 | Tragic 25.5% |
| Hopi | 0.0 /100 | #339 | Tragic 25.3% |
| Lumbee | 0.0 /100 | #340 | Tragic 24.8% |
| Yuman | 0.0 /100 | #341 | Tragic 24.5% |
| Yakama | 0.0 /100 | #342 | Tragic 24.5% |
| Tohono O'odham | 0.0 /100 | #343 | Tragic 24.4% |
| Navajo | 0.0 /100 | #344 | Tragic 23.6% |
| Pima | 0.0 /100 | #345 | Tragic 23.2% |
| Houma | 0.0 /100 | #346 | Tragic 21.4% |
| Yup'ik | 0.0 /100 | #347 | Tragic 19.4% |
Demographics Similar to Immigrants from Costa Rica by Bachelor's Degree
In terms of bachelor's degree, the demographic groups most similar to Immigrants from Costa Rica are Immigrants from Ghana (36.9%, a difference of 0.0%), Welsh (37.0%, a difference of 0.21%), Czechoslovakian (37.0%, a difference of 0.22%), Celtic (37.0%, a difference of 0.26%), and Immigrants from South Eastern Asia (36.8%, a difference of 0.26%).
| Demographics | Rating | Rank | Bachelor's Degree |
| Immigrants | Vietnam | 32.1 /100 | #192 | Fair 37.1% |
| Yugoslavians | 31.5 /100 | #193 | Fair 37.1% |
| Belgians | 29.9 /100 | #194 | Fair 37.0% |
| Koreans | 29.8 /100 | #195 | Fair 37.0% |
| Celtics | 29.5 /100 | #196 | Fair 37.0% |
| Czechoslovakians | 29.2 /100 | #197 | Fair 37.0% |
| Welsh | 29.1 /100 | #198 | Fair 37.0% |
| Immigrants | Costa Rica | 27.4 /100 | #199 | Fair 36.9% |
| Immigrants | Ghana | 27.4 /100 | #200 | Fair 36.9% |
| Immigrants | South Eastern Asia | 25.4 /100 | #201 | Fair 36.8% |
| Immigrants | Zaire | 25.3 /100 | #202 | Fair 36.8% |
| Immigrants | Nigeria | 23.1 /100 | #203 | Fair 36.7% |
| Immigrants | Immigrants | 22.8 /100 | #204 | Fair 36.7% |
| Finns | 22.2 /100 | #205 | Fair 36.7% |
| Spaniards | 21.2 /100 | #206 | Fair 36.6% |