Malaysian vs Immigrants from North Macedonia Doctorate Degree
COMPARE
Malaysian
Immigrants from North Macedonia
Doctorate Degree
Doctorate Degree Comparison
Malaysians
Immigrants from North Macedonia
1.5%
DOCTORATE DEGREE
0.3/ 100
METRIC RATING
285th/ 347
METRIC RANK
1.6%
DOCTORATE DEGREE
3.9/ 100
METRIC RATING
231st/ 347
METRIC RANK
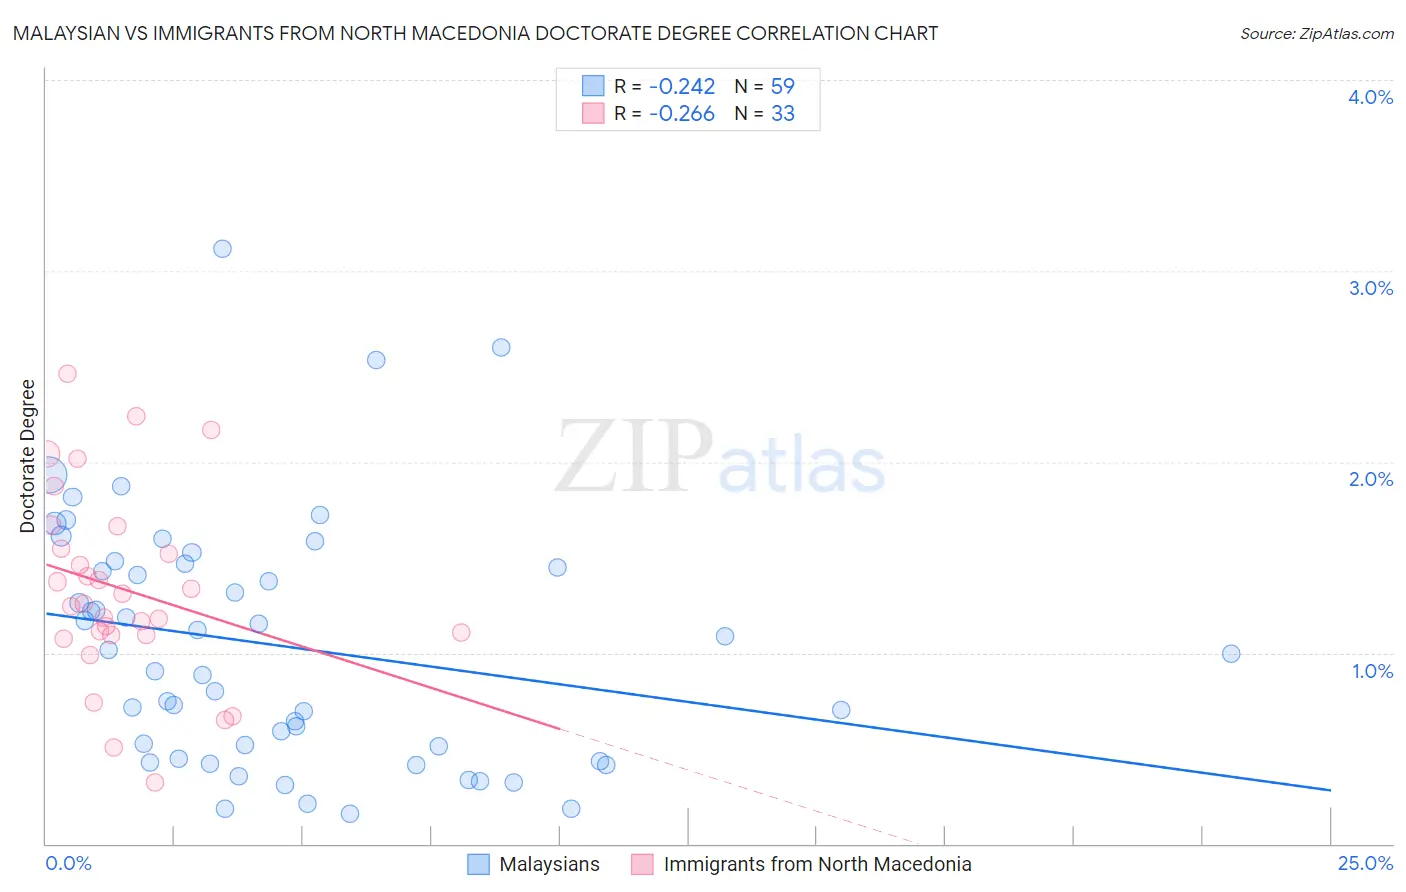
Malaysian vs Immigrants from North Macedonia Doctorate Degree Correlation Chart
The statistical analysis conducted on geographies consisting of 224,756,978 people shows a weak negative correlation between the proportion of Malaysians and percentage of population with at least doctorate degree education in the United States with a correlation coefficient (R) of -0.242 and weighted average of 1.5%. Similarly, the statistical analysis conducted on geographies consisting of 73,878,917 people shows a weak negative correlation between the proportion of Immigrants from North Macedonia and percentage of population with at least doctorate degree education in the United States with a correlation coefficient (R) of -0.266 and weighted average of 1.6%, a difference of 11.5%.
Doctorate Degree Correlation Summary
| Measurement | Malaysian | Immigrants from North Macedonia |
| Minimum | 0.16% | 0.32% |
| Maximum | 3.1% | 2.5% |
| Range | 3.0% | 2.1% |
| Mean | 1.0% | 1.3% |
| Median | 1.00% | 1.3% |
| Interquartile 25% (IQ1) | 0.45% | 1.1% |
| Interquartile 75% (IQ3) | 1.5% | 1.6% |
| Interquartile Range (IQR) | 1.0% | 0.51% |
| Standard Deviation (Sample) | 0.65% | 0.50% |
| Standard Deviation (Population) | 0.64% | 0.49% |
Similar Demographics by Doctorate Degree
Demographics Similar to Malaysians by Doctorate Degree
In terms of doctorate degree, the demographic groups most similar to Malaysians are Jamaican (1.5%, a difference of 0.030%), Central American (1.5%, a difference of 0.070%), British West Indian (1.5%, a difference of 0.11%), Tohono O'odham (1.5%, a difference of 0.17%), and Cherokee (1.5%, a difference of 0.18%).
| Demographics | Rating | Rank | Doctorate Degree |
| Hawaiians | 0.4 /100 | #278 | Tragic 1.5% |
| Marshallese | 0.4 /100 | #279 | Tragic 1.5% |
| Ecuadorians | 0.4 /100 | #280 | Tragic 1.5% |
| Tohono O'odham | 0.4 /100 | #281 | Tragic 1.5% |
| British West Indians | 0.3 /100 | #282 | Tragic 1.5% |
| Central Americans | 0.3 /100 | #283 | Tragic 1.5% |
| Jamaicans | 0.3 /100 | #284 | Tragic 1.5% |
| Malaysians | 0.3 /100 | #285 | Tragic 1.5% |
| Cherokee | 0.3 /100 | #286 | Tragic 1.5% |
| Cajuns | 0.3 /100 | #287 | Tragic 1.5% |
| Immigrants | El Salvador | 0.3 /100 | #288 | Tragic 1.4% |
| Cape Verdeans | 0.3 /100 | #289 | Tragic 1.4% |
| Choctaw | 0.3 /100 | #290 | Tragic 1.4% |
| Blacks/African Americans | 0.3 /100 | #291 | Tragic 1.4% |
| Alaska Natives | 0.3 /100 | #292 | Tragic 1.4% |
Demographics Similar to Immigrants from North Macedonia by Doctorate Degree
In terms of doctorate degree, the demographic groups most similar to Immigrants from North Macedonia are Immigrants from Philippines (1.6%, a difference of 0.47%), Guamanian/Chamorro (1.6%, a difference of 0.69%), Barbadian (1.6%, a difference of 0.76%), Colville (1.6%, a difference of 0.78%), and Hopi (1.6%, a difference of 0.90%).
| Demographics | Rating | Rank | Doctorate Degree |
| Immigrants | Poland | 7.4 /100 | #224 | Tragic 1.7% |
| Immigrants | Colombia | 6.7 /100 | #225 | Tragic 1.7% |
| Osage | 6.5 /100 | #226 | Tragic 1.7% |
| Panamanians | 6.3 /100 | #227 | Tragic 1.7% |
| Assyrians/Chaldeans/Syriacs | 5.9 /100 | #228 | Tragic 1.7% |
| Colville | 4.7 /100 | #229 | Tragic 1.6% |
| Immigrants | Philippines | 4.3 /100 | #230 | Tragic 1.6% |
| Immigrants | North Macedonia | 3.9 /100 | #231 | Tragic 1.6% |
| Guamanians/Chamorros | 3.3 /100 | #232 | Tragic 1.6% |
| Barbadians | 3.3 /100 | #233 | Tragic 1.6% |
| Hopi | 3.2 /100 | #234 | Tragic 1.6% |
| Cree | 3.0 /100 | #235 | Tragic 1.6% |
| Indonesians | 2.8 /100 | #236 | Tragic 1.6% |
| Iroquois | 2.7 /100 | #237 | Tragic 1.6% |
| Immigrants | Congo | 2.6 /100 | #238 | Tragic 1.6% |