Slavic vs Immigrants from North Macedonia Doctorate Degree
COMPARE
Slavic
Immigrants from North Macedonia
Doctorate Degree
Doctorate Degree Comparison
Slavs
Immigrants from North Macedonia
1.9%
DOCTORATE DEGREE
72.4/ 100
METRIC RATING
156th/ 347
METRIC RANK
1.6%
DOCTORATE DEGREE
3.9/ 100
METRIC RATING
231st/ 347
METRIC RANK
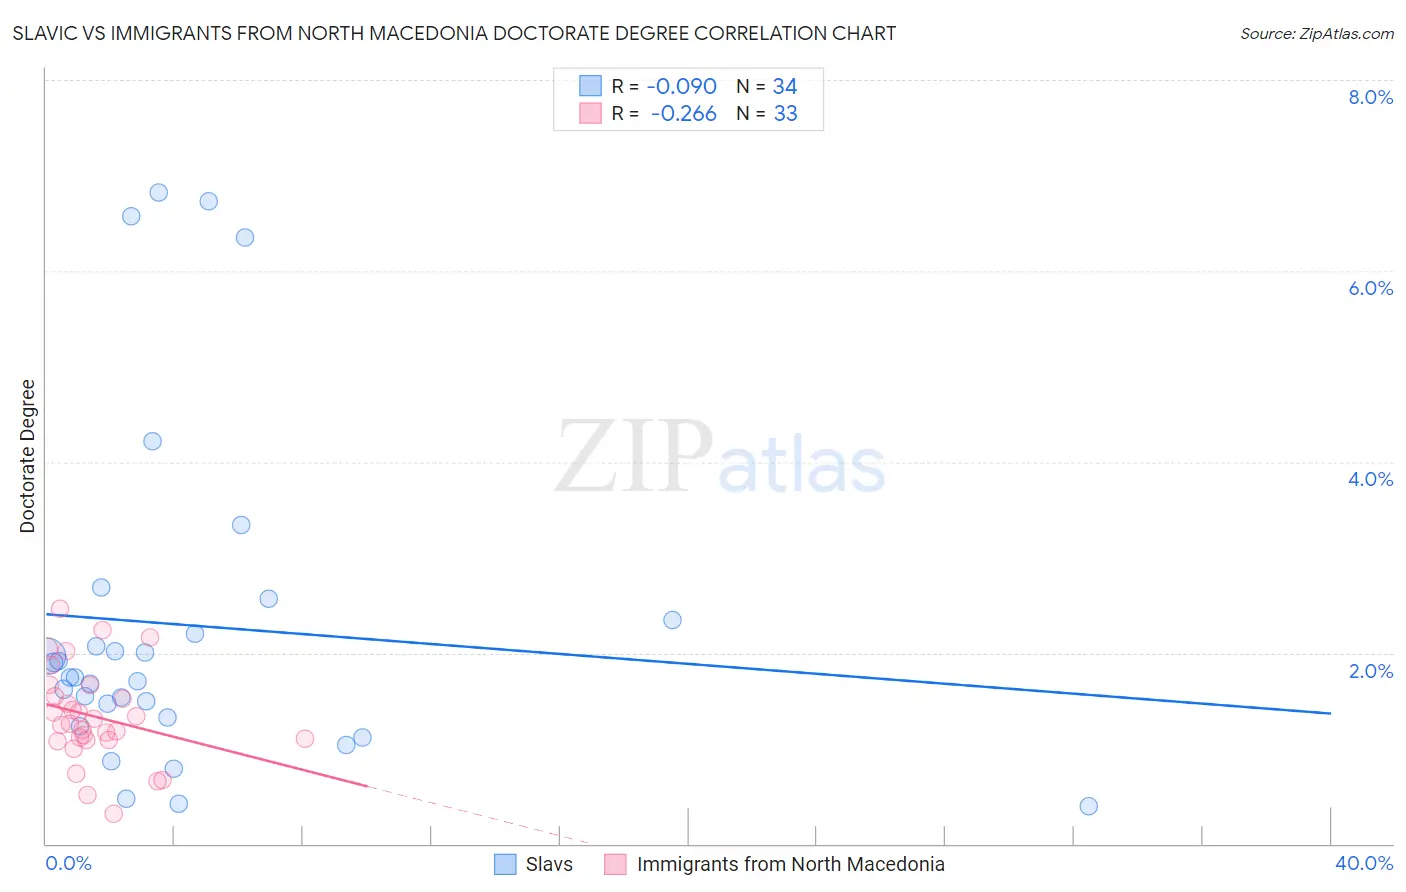
Slavic vs Immigrants from North Macedonia Doctorate Degree Correlation Chart
The statistical analysis conducted on geographies consisting of 269,161,958 people shows a slight negative correlation between the proportion of Slavs and percentage of population with at least doctorate degree education in the United States with a correlation coefficient (R) of -0.090 and weighted average of 1.9%. Similarly, the statistical analysis conducted on geographies consisting of 73,878,917 people shows a weak negative correlation between the proportion of Immigrants from North Macedonia and percentage of population with at least doctorate degree education in the United States with a correlation coefficient (R) of -0.266 and weighted average of 1.6%, a difference of 17.3%.
Doctorate Degree Correlation Summary
| Measurement | Slavic | Immigrants from North Macedonia |
| Minimum | 0.39% | 0.32% |
| Maximum | 6.8% | 2.5% |
| Range | 6.4% | 2.1% |
| Mean | 2.3% | 1.3% |
| Median | 1.7% | 1.3% |
| Interquartile 25% (IQ1) | 1.3% | 1.1% |
| Interquartile 75% (IQ3) | 2.3% | 1.6% |
| Interquartile Range (IQR) | 1.0% | 0.51% |
| Standard Deviation (Sample) | 1.8% | 0.50% |
| Standard Deviation (Population) | 1.8% | 0.49% |
Similar Demographics by Doctorate Degree
Demographics Similar to Slavs by Doctorate Degree
In terms of doctorate degree, the demographic groups most similar to Slavs are Polish (1.9%, a difference of 0.060%), Immigrants from Albania (1.9%, a difference of 0.080%), Danish (1.9%, a difference of 0.090%), Hungarian (1.9%, a difference of 0.11%), and Immigrants from Oceania (1.9%, a difference of 0.30%).
| Demographics | Rating | Rank | Doctorate Degree |
| Basques | 76.9 /100 | #149 | Good 1.9% |
| English | 75.9 /100 | #150 | Good 1.9% |
| Albanians | 74.8 /100 | #151 | Good 1.9% |
| Immigrants | Kenya | 74.3 /100 | #152 | Good 1.9% |
| Immigrants | Oceania | 74.0 /100 | #153 | Good 1.9% |
| Immigrants | Albania | 72.8 /100 | #154 | Good 1.9% |
| Poles | 72.7 /100 | #155 | Good 1.9% |
| Slavs | 72.4 /100 | #156 | Good 1.9% |
| Danes | 71.9 /100 | #157 | Good 1.9% |
| Hungarians | 71.7 /100 | #158 | Good 1.9% |
| Slovenes | 70.2 /100 | #159 | Good 1.9% |
| Welsh | 69.7 /100 | #160 | Good 1.9% |
| Immigrants | Middle Africa | 68.8 /100 | #161 | Good 1.9% |
| Irish | 67.5 /100 | #162 | Good 1.9% |
| Czechs | 67.3 /100 | #163 | Good 1.9% |
Demographics Similar to Immigrants from North Macedonia by Doctorate Degree
In terms of doctorate degree, the demographic groups most similar to Immigrants from North Macedonia are Immigrants from Philippines (1.6%, a difference of 0.47%), Guamanian/Chamorro (1.6%, a difference of 0.69%), Barbadian (1.6%, a difference of 0.76%), Colville (1.6%, a difference of 0.78%), and Hopi (1.6%, a difference of 0.90%).
| Demographics | Rating | Rank | Doctorate Degree |
| Immigrants | Poland | 7.4 /100 | #224 | Tragic 1.7% |
| Immigrants | Colombia | 6.7 /100 | #225 | Tragic 1.7% |
| Osage | 6.5 /100 | #226 | Tragic 1.7% |
| Panamanians | 6.3 /100 | #227 | Tragic 1.7% |
| Assyrians/Chaldeans/Syriacs | 5.9 /100 | #228 | Tragic 1.7% |
| Colville | 4.7 /100 | #229 | Tragic 1.6% |
| Immigrants | Philippines | 4.3 /100 | #230 | Tragic 1.6% |
| Immigrants | North Macedonia | 3.9 /100 | #231 | Tragic 1.6% |
| Guamanians/Chamorros | 3.3 /100 | #232 | Tragic 1.6% |
| Barbadians | 3.3 /100 | #233 | Tragic 1.6% |
| Hopi | 3.2 /100 | #234 | Tragic 1.6% |
| Cree | 3.0 /100 | #235 | Tragic 1.6% |
| Indonesians | 2.8 /100 | #236 | Tragic 1.6% |
| Iroquois | 2.7 /100 | #237 | Tragic 1.6% |
| Immigrants | Congo | 2.6 /100 | #238 | Tragic 1.6% |