Yakama vs Immigrants from North Macedonia Doctorate Degree
COMPARE
Yakama
Immigrants from North Macedonia
Doctorate Degree
Doctorate Degree Comparison
Yakama
Immigrants from North Macedonia
1.3%
DOCTORATE DEGREE
0.0/ 100
METRIC RATING
332nd/ 347
METRIC RANK
1.6%
DOCTORATE DEGREE
3.9/ 100
METRIC RATING
231st/ 347
METRIC RANK
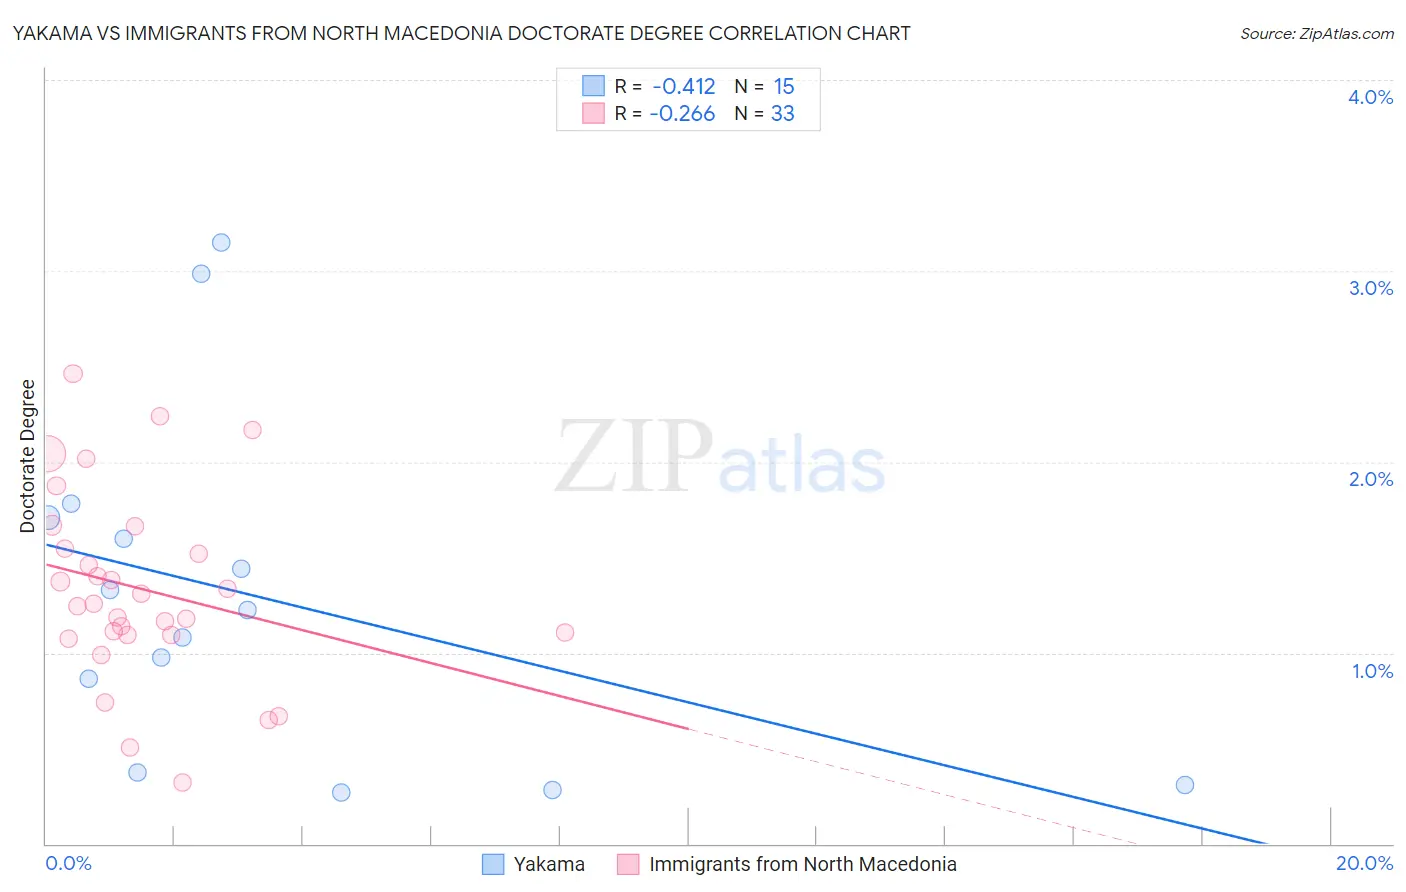
Yakama vs Immigrants from North Macedonia Doctorate Degree Correlation Chart
The statistical analysis conducted on geographies consisting of 19,742,770 people shows a moderate negative correlation between the proportion of Yakama and percentage of population with at least doctorate degree education in the United States with a correlation coefficient (R) of -0.412 and weighted average of 1.3%. Similarly, the statistical analysis conducted on geographies consisting of 73,878,917 people shows a weak negative correlation between the proportion of Immigrants from North Macedonia and percentage of population with at least doctorate degree education in the United States with a correlation coefficient (R) of -0.266 and weighted average of 1.6%, a difference of 26.5%.
Doctorate Degree Correlation Summary
| Measurement | Yakama | Immigrants from North Macedonia |
| Minimum | 0.27% | 0.32% |
| Maximum | 3.1% | 2.5% |
| Range | 2.9% | 2.1% |
| Mean | 1.3% | 1.3% |
| Median | 1.2% | 1.3% |
| Interquartile 25% (IQ1) | 0.37% | 1.1% |
| Interquartile 75% (IQ3) | 1.7% | 1.6% |
| Interquartile Range (IQR) | 1.3% | 0.51% |
| Standard Deviation (Sample) | 0.89% | 0.50% |
| Standard Deviation (Population) | 0.86% | 0.49% |
Similar Demographics by Doctorate Degree
Demographics Similar to Yakama by Doctorate Degree
In terms of doctorate degree, the demographic groups most similar to Yakama are Immigrants from Caribbean (1.3%, a difference of 0.16%), Immigrants from Dominican Republic (1.3%, a difference of 0.35%), Immigrants from Latin America (1.3%, a difference of 1.6%), Yup'ik (1.3%, a difference of 1.6%), and Haitian (1.3%, a difference of 1.8%).
| Demographics | Rating | Rank | Doctorate Degree |
| Pima | 0.0 /100 | #325 | Tragic 1.3% |
| Immigrants | Cabo Verde | 0.0 /100 | #326 | Tragic 1.3% |
| Hispanics or Latinos | 0.0 /100 | #327 | Tragic 1.3% |
| Inupiat | 0.0 /100 | #328 | Tragic 1.3% |
| Haitians | 0.0 /100 | #329 | Tragic 1.3% |
| Yup'ik | 0.0 /100 | #330 | Tragic 1.3% |
| Immigrants | Latin America | 0.0 /100 | #331 | Tragic 1.3% |
| Yakama | 0.0 /100 | #332 | Tragic 1.3% |
| Immigrants | Caribbean | 0.0 /100 | #333 | Tragic 1.3% |
| Immigrants | Dominican Republic | 0.0 /100 | #334 | Tragic 1.3% |
| Immigrants | Haiti | 0.0 /100 | #335 | Tragic 1.3% |
| Nepalese | 0.0 /100 | #336 | Tragic 1.3% |
| Bangladeshis | 0.0 /100 | #337 | Tragic 1.2% |
| Puget Sound Salish | 0.0 /100 | #338 | Tragic 1.2% |
| Immigrants | Central America | 0.0 /100 | #339 | Tragic 1.2% |
Demographics Similar to Immigrants from North Macedonia by Doctorate Degree
In terms of doctorate degree, the demographic groups most similar to Immigrants from North Macedonia are Immigrants from Philippines (1.6%, a difference of 0.47%), Guamanian/Chamorro (1.6%, a difference of 0.69%), Barbadian (1.6%, a difference of 0.76%), Colville (1.6%, a difference of 0.78%), and Hopi (1.6%, a difference of 0.90%).
| Demographics | Rating | Rank | Doctorate Degree |
| Immigrants | Poland | 7.4 /100 | #224 | Tragic 1.7% |
| Immigrants | Colombia | 6.7 /100 | #225 | Tragic 1.7% |
| Osage | 6.5 /100 | #226 | Tragic 1.7% |
| Panamanians | 6.3 /100 | #227 | Tragic 1.7% |
| Assyrians/Chaldeans/Syriacs | 5.9 /100 | #228 | Tragic 1.7% |
| Colville | 4.7 /100 | #229 | Tragic 1.6% |
| Immigrants | Philippines | 4.3 /100 | #230 | Tragic 1.6% |
| Immigrants | North Macedonia | 3.9 /100 | #231 | Tragic 1.6% |
| Guamanians/Chamorros | 3.3 /100 | #232 | Tragic 1.6% |
| Barbadians | 3.3 /100 | #233 | Tragic 1.6% |
| Hopi | 3.2 /100 | #234 | Tragic 1.6% |
| Cree | 3.0 /100 | #235 | Tragic 1.6% |
| Indonesians | 2.8 /100 | #236 | Tragic 1.6% |
| Iroquois | 2.7 /100 | #237 | Tragic 1.6% |
| Immigrants | Congo | 2.6 /100 | #238 | Tragic 1.6% |