Puerto Rican vs Immigrants from North Macedonia Doctorate Degree
COMPARE
Puerto Rican
Immigrants from North Macedonia
Doctorate Degree
Doctorate Degree Comparison
Puerto Ricans
Immigrants from North Macedonia
1.4%
DOCTORATE DEGREE
0.1/ 100
METRIC RATING
298th/ 347
METRIC RANK
1.6%
DOCTORATE DEGREE
3.9/ 100
METRIC RATING
231st/ 347
METRIC RANK
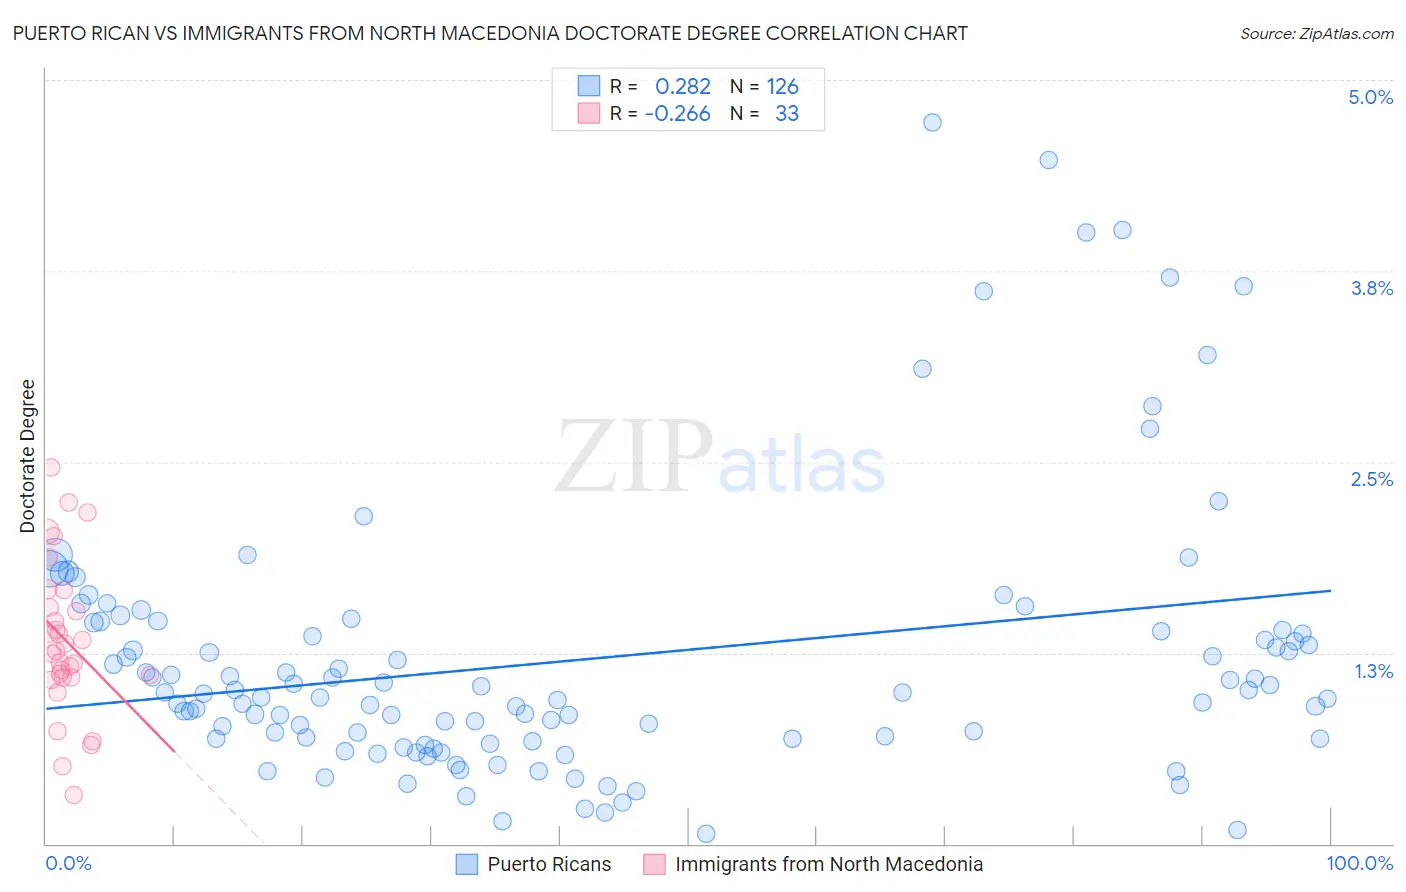
Puerto Rican vs Immigrants from North Macedonia Doctorate Degree Correlation Chart
The statistical analysis conducted on geographies consisting of 514,802,619 people shows a weak positive correlation between the proportion of Puerto Ricans and percentage of population with at least doctorate degree education in the United States with a correlation coefficient (R) of 0.282 and weighted average of 1.4%. Similarly, the statistical analysis conducted on geographies consisting of 73,878,917 people shows a weak negative correlation between the proportion of Immigrants from North Macedonia and percentage of population with at least doctorate degree education in the United States with a correlation coefficient (R) of -0.266 and weighted average of 1.6%, a difference of 15.9%.
Doctorate Degree Correlation Summary
| Measurement | Puerto Rican | Immigrants from North Macedonia |
| Minimum | 0.063% | 0.32% |
| Maximum | 4.7% | 2.5% |
| Range | 4.7% | 2.1% |
| Mean | 1.2% | 1.3% |
| Median | 0.99% | 1.3% |
| Interquartile 25% (IQ1) | 0.69% | 1.1% |
| Interquartile 75% (IQ3) | 1.4% | 1.6% |
| Interquartile Range (IQR) | 0.71% | 0.51% |
| Standard Deviation (Sample) | 0.89% | 0.50% |
| Standard Deviation (Population) | 0.89% | 0.49% |
Similar Demographics by Doctorate Degree
Demographics Similar to Puerto Ricans by Doctorate Degree
In terms of doctorate degree, the demographic groups most similar to Puerto Ricans are Tsimshian (1.4%, a difference of 0.41%), Belizean (1.4%, a difference of 0.43%), Immigrants from Ecuador (1.4%, a difference of 0.63%), Immigrants from Guatemala (1.4%, a difference of 0.76%), and Honduran (1.4%, a difference of 0.83%).
| Demographics | Rating | Rank | Doctorate Degree |
| Blacks/African Americans | 0.3 /100 | #291 | Tragic 1.4% |
| Alaska Natives | 0.3 /100 | #292 | Tragic 1.4% |
| Immigrants | Yemen | 0.2 /100 | #293 | Tragic 1.4% |
| Samoans | 0.2 /100 | #294 | Tragic 1.4% |
| Guatemalans | 0.2 /100 | #295 | Tragic 1.4% |
| Immigrants | Ecuador | 0.2 /100 | #296 | Tragic 1.4% |
| Tsimshian | 0.2 /100 | #297 | Tragic 1.4% |
| Puerto Ricans | 0.1 /100 | #298 | Tragic 1.4% |
| Belizeans | 0.1 /100 | #299 | Tragic 1.4% |
| Immigrants | Guatemala | 0.1 /100 | #300 | Tragic 1.4% |
| Hondurans | 0.1 /100 | #301 | Tragic 1.4% |
| Shoshone | 0.1 /100 | #302 | Tragic 1.4% |
| Immigrants | Dominica | 0.1 /100 | #303 | Tragic 1.4% |
| Mexican American Indians | 0.1 /100 | #304 | Tragic 1.4% |
| Pennsylvania Germans | 0.1 /100 | #305 | Tragic 1.4% |
Demographics Similar to Immigrants from North Macedonia by Doctorate Degree
In terms of doctorate degree, the demographic groups most similar to Immigrants from North Macedonia are Immigrants from Philippines (1.6%, a difference of 0.47%), Guamanian/Chamorro (1.6%, a difference of 0.69%), Barbadian (1.6%, a difference of 0.76%), Colville (1.6%, a difference of 0.78%), and Hopi (1.6%, a difference of 0.90%).
| Demographics | Rating | Rank | Doctorate Degree |
| Immigrants | Poland | 7.4 /100 | #224 | Tragic 1.7% |
| Immigrants | Colombia | 6.7 /100 | #225 | Tragic 1.7% |
| Osage | 6.5 /100 | #226 | Tragic 1.7% |
| Panamanians | 6.3 /100 | #227 | Tragic 1.7% |
| Assyrians/Chaldeans/Syriacs | 5.9 /100 | #228 | Tragic 1.7% |
| Colville | 4.7 /100 | #229 | Tragic 1.6% |
| Immigrants | Philippines | 4.3 /100 | #230 | Tragic 1.6% |
| Immigrants | North Macedonia | 3.9 /100 | #231 | Tragic 1.6% |
| Guamanians/Chamorros | 3.3 /100 | #232 | Tragic 1.6% |
| Barbadians | 3.3 /100 | #233 | Tragic 1.6% |
| Hopi | 3.2 /100 | #234 | Tragic 1.6% |
| Cree | 3.0 /100 | #235 | Tragic 1.6% |
| Indonesians | 2.8 /100 | #236 | Tragic 1.6% |
| Iroquois | 2.7 /100 | #237 | Tragic 1.6% |
| Immigrants | Congo | 2.6 /100 | #238 | Tragic 1.6% |