Lumbee vs German Russian GED/Equivalency
COMPARE
Lumbee
German Russian
GED/Equivalency
GED/Equivalency Comparison
Lumbee
German Russians
80.0%
GED/EQUIVALENCY
0.0/ 100
METRIC RATING
322nd/ 347
METRIC RANK
86.2%
GED/EQUIVALENCY
72.1/ 100
METRIC RATING
158th/ 347
METRIC RANK
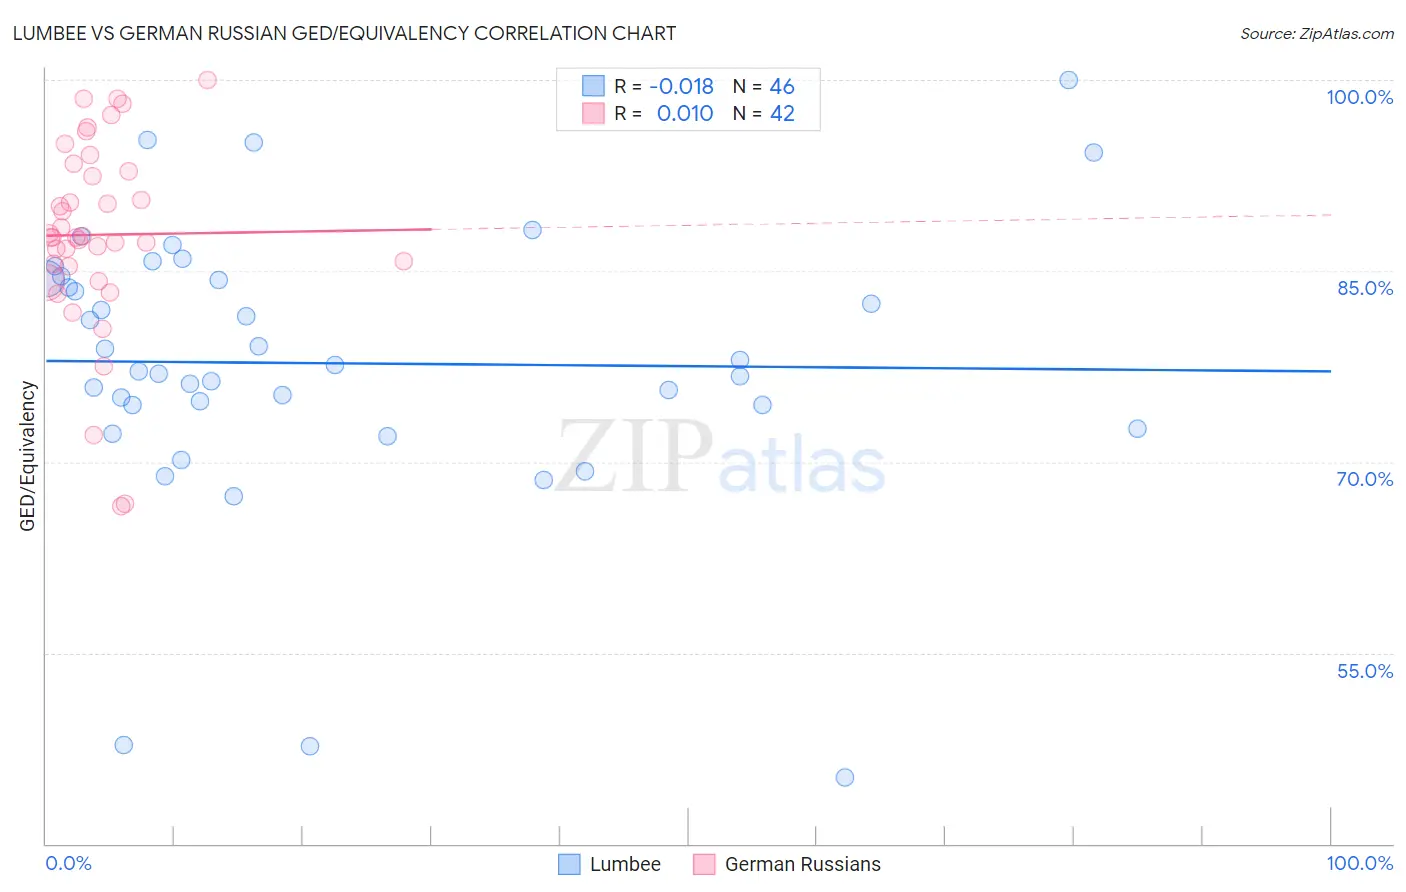
Lumbee vs German Russian GED/Equivalency Correlation Chart
The statistical analysis conducted on geographies consisting of 92,299,068 people shows no correlation between the proportion of Lumbee and percentage of population with at least ged/equivalency education in the United States with a correlation coefficient (R) of -0.018 and weighted average of 80.0%. Similarly, the statistical analysis conducted on geographies consisting of 96,461,736 people shows no correlation between the proportion of German Russians and percentage of population with at least ged/equivalency education in the United States with a correlation coefficient (R) of 0.010 and weighted average of 86.2%, a difference of 7.8%.
GED/Equivalency Correlation Summary
| Measurement | Lumbee | German Russian |
| Minimum | 45.2% | 66.5% |
| Maximum | 100.0% | 100.0% |
| Range | 54.8% | 33.5% |
| Mean | 77.7% | 87.8% |
| Median | 77.4% | 87.6% |
| Interquartile 25% (IQ1) | 74.5% | 85.4% |
| Interquartile 75% (IQ3) | 84.4% | 92.9% |
| Interquartile Range (IQR) | 10.0% | 7.5% |
| Standard Deviation (Sample) | 11.1% | 7.6% |
| Standard Deviation (Population) | 11.0% | 7.5% |
Similar Demographics by GED/Equivalency
Demographics Similar to Lumbee by GED/Equivalency
In terms of ged/equivalency, the demographic groups most similar to Lumbee are Yup'ik (80.0%, a difference of 0.070%), Immigrants from Nicaragua (79.9%, a difference of 0.12%), Immigrants from Cuba (80.2%, a difference of 0.24%), Yaqui (80.5%, a difference of 0.65%), and Immigrants from Belize (80.5%, a difference of 0.65%).
| Demographics | Rating | Rank | GED/Equivalency |
| Apache | 0.0 /100 | #315 | Tragic 80.7% |
| Central American Indians | 0.0 /100 | #316 | Tragic 80.6% |
| Immigrants | Caribbean | 0.0 /100 | #317 | Tragic 80.5% |
| Yaqui | 0.0 /100 | #318 | Tragic 80.5% |
| Immigrants | Belize | 0.0 /100 | #319 | Tragic 80.5% |
| Immigrants | Cuba | 0.0 /100 | #320 | Tragic 80.2% |
| Yup'ik | 0.0 /100 | #321 | Tragic 80.0% |
| Lumbee | 0.0 /100 | #322 | Tragic 80.0% |
| Immigrants | Nicaragua | 0.0 /100 | #323 | Tragic 79.9% |
| Mexican American Indians | 0.0 /100 | #324 | Tragic 79.4% |
| Hondurans | 0.0 /100 | #325 | Tragic 79.3% |
| Yuman | 0.0 /100 | #326 | Tragic 79.2% |
| Central Americans | 0.0 /100 | #327 | Tragic 79.2% |
| Hispanics or Latinos | 0.0 /100 | #328 | Tragic 79.1% |
| Dominicans | 0.0 /100 | #329 | Tragic 79.1% |
Demographics Similar to German Russians by GED/Equivalency
In terms of ged/equivalency, the demographic groups most similar to German Russians are White/Caucasian (86.2%, a difference of 0.0%), Immigrants from Kenya (86.2%, a difference of 0.010%), Immigrants from Nepal (86.2%, a difference of 0.030%), Immigrants from Morocco (86.1%, a difference of 0.060%), and Immigrants from Syria (86.1%, a difference of 0.070%).
| Demographics | Rating | Rank | GED/Equivalency |
| Immigrants | Bosnia and Herzegovina | 77.9 /100 | #151 | Good 86.3% |
| Brazilians | 77.2 /100 | #152 | Good 86.3% |
| Kenyans | 76.6 /100 | #153 | Good 86.3% |
| Armenians | 76.4 /100 | #154 | Good 86.3% |
| Iraqis | 75.2 /100 | #155 | Good 86.2% |
| Immigrants | Nepal | 73.3 /100 | #156 | Good 86.2% |
| Whites/Caucasians | 72.2 /100 | #157 | Good 86.2% |
| German Russians | 72.1 /100 | #158 | Good 86.2% |
| Immigrants | Kenya | 71.8 /100 | #159 | Good 86.2% |
| Immigrants | Morocco | 69.5 /100 | #160 | Good 86.1% |
| Immigrants | Syria | 69.3 /100 | #161 | Good 86.1% |
| Immigrants | Iraq | 68.1 /100 | #162 | Good 86.1% |
| Ugandans | 66.3 /100 | #163 | Good 86.1% |
| Venezuelans | 65.5 /100 | #164 | Good 86.0% |
| Alsatians | 64.3 /100 | #165 | Good 86.0% |