Lumbee vs Peruvian GED/Equivalency
COMPARE
Lumbee
Peruvian
GED/Equivalency
GED/Equivalency Comparison
Lumbee
Peruvians
80.0%
GED/EQUIVALENCY
0.0/ 100
METRIC RATING
322nd/ 347
METRIC RANK
84.7%
GED/EQUIVALENCY
9.2/ 100
METRIC RATING
215th/ 347
METRIC RANK
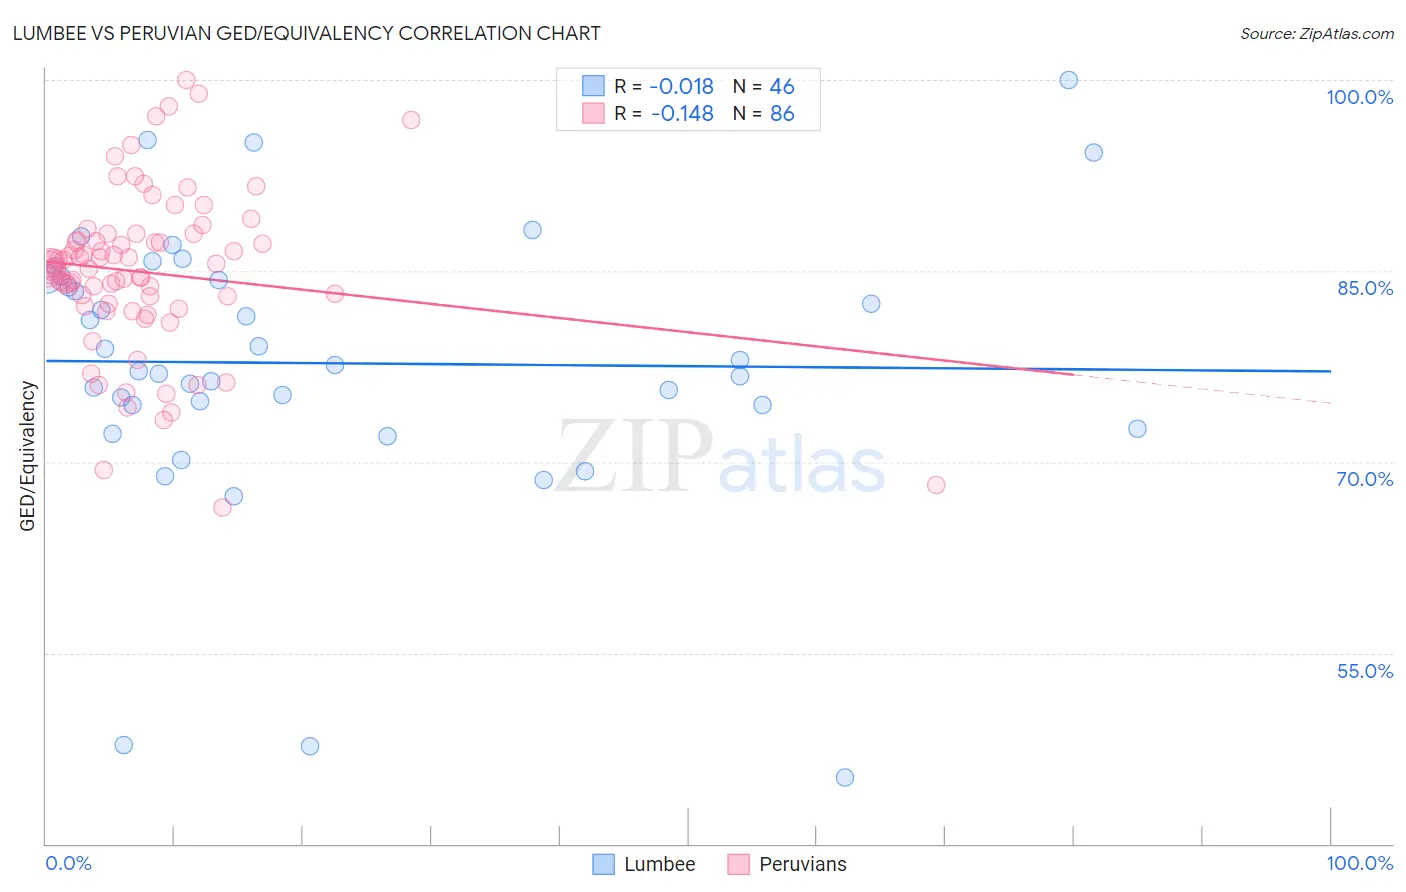
Lumbee vs Peruvian GED/Equivalency Correlation Chart
The statistical analysis conducted on geographies consisting of 92,299,068 people shows no correlation between the proportion of Lumbee and percentage of population with at least ged/equivalency education in the United States with a correlation coefficient (R) of -0.018 and weighted average of 80.0%. Similarly, the statistical analysis conducted on geographies consisting of 363,251,075 people shows a poor negative correlation between the proportion of Peruvians and percentage of population with at least ged/equivalency education in the United States with a correlation coefficient (R) of -0.148 and weighted average of 84.7%, a difference of 6.0%.
GED/Equivalency Correlation Summary
| Measurement | Lumbee | Peruvian |
| Minimum | 45.2% | 66.4% |
| Maximum | 100.0% | 100.0% |
| Range | 54.8% | 33.6% |
| Mean | 77.7% | 84.9% |
| Median | 77.4% | 85.2% |
| Interquartile 25% (IQ1) | 74.5% | 82.5% |
| Interquartile 75% (IQ3) | 84.4% | 87.5% |
| Interquartile Range (IQR) | 10.0% | 5.0% |
| Standard Deviation (Sample) | 11.1% | 6.4% |
| Standard Deviation (Population) | 11.0% | 6.3% |
Similar Demographics by GED/Equivalency
Demographics Similar to Lumbee by GED/Equivalency
In terms of ged/equivalency, the demographic groups most similar to Lumbee are Yup'ik (80.0%, a difference of 0.070%), Immigrants from Nicaragua (79.9%, a difference of 0.12%), Immigrants from Cuba (80.2%, a difference of 0.24%), Yaqui (80.5%, a difference of 0.65%), and Immigrants from Belize (80.5%, a difference of 0.65%).
| Demographics | Rating | Rank | GED/Equivalency |
| Apache | 0.0 /100 | #315 | Tragic 80.7% |
| Central American Indians | 0.0 /100 | #316 | Tragic 80.6% |
| Immigrants | Caribbean | 0.0 /100 | #317 | Tragic 80.5% |
| Yaqui | 0.0 /100 | #318 | Tragic 80.5% |
| Immigrants | Belize | 0.0 /100 | #319 | Tragic 80.5% |
| Immigrants | Cuba | 0.0 /100 | #320 | Tragic 80.2% |
| Yup'ik | 0.0 /100 | #321 | Tragic 80.0% |
| Lumbee | 0.0 /100 | #322 | Tragic 80.0% |
| Immigrants | Nicaragua | 0.0 /100 | #323 | Tragic 79.9% |
| Mexican American Indians | 0.0 /100 | #324 | Tragic 79.4% |
| Hondurans | 0.0 /100 | #325 | Tragic 79.3% |
| Yuman | 0.0 /100 | #326 | Tragic 79.2% |
| Central Americans | 0.0 /100 | #327 | Tragic 79.2% |
| Hispanics or Latinos | 0.0 /100 | #328 | Tragic 79.1% |
| Dominicans | 0.0 /100 | #329 | Tragic 79.1% |
Demographics Similar to Peruvians by GED/Equivalency
In terms of ged/equivalency, the demographic groups most similar to Peruvians are Osage (84.8%, a difference of 0.020%), Immigrants from Micronesia (84.7%, a difference of 0.030%), Nigerian (84.7%, a difference of 0.030%), Alaska Native (84.7%, a difference of 0.030%), and Immigrants from Philippines (84.8%, a difference of 0.050%).
| Demographics | Rating | Rank | GED/Equivalency |
| Marshallese | 12.5 /100 | #208 | Poor 84.9% |
| Colombians | 12.3 /100 | #209 | Poor 84.9% |
| Immigrants | Cameroon | 12.1 /100 | #210 | Poor 84.9% |
| South Americans | 10.9 /100 | #211 | Poor 84.8% |
| Immigrants | Somalia | 10.6 /100 | #212 | Poor 84.8% |
| Immigrants | Philippines | 10.0 /100 | #213 | Poor 84.8% |
| Osage | 9.5 /100 | #214 | Tragic 84.8% |
| Peruvians | 9.2 /100 | #215 | Tragic 84.7% |
| Immigrants | Micronesia | 8.7 /100 | #216 | Tragic 84.7% |
| Nigerians | 8.6 /100 | #217 | Tragic 84.7% |
| Alaska Natives | 8.6 /100 | #218 | Tragic 84.7% |
| Potawatomi | 8.2 /100 | #219 | Tragic 84.7% |
| Americans | 8.2 /100 | #220 | Tragic 84.7% |
| Taiwanese | 8.1 /100 | #221 | Tragic 84.7% |
| Iroquois | 7.5 /100 | #222 | Tragic 84.6% |