Lumbee vs German Russian 10th Grade
COMPARE
Lumbee
German Russian
10th Grade
10th Grade Comparison
Lumbee
German Russians
91.7%
10TH GRADE
0.0/ 100
METRIC RATING
295th/ 347
METRIC RANK
94.4%
10TH GRADE
96.3/ 100
METRIC RATING
114th/ 347
METRIC RANK
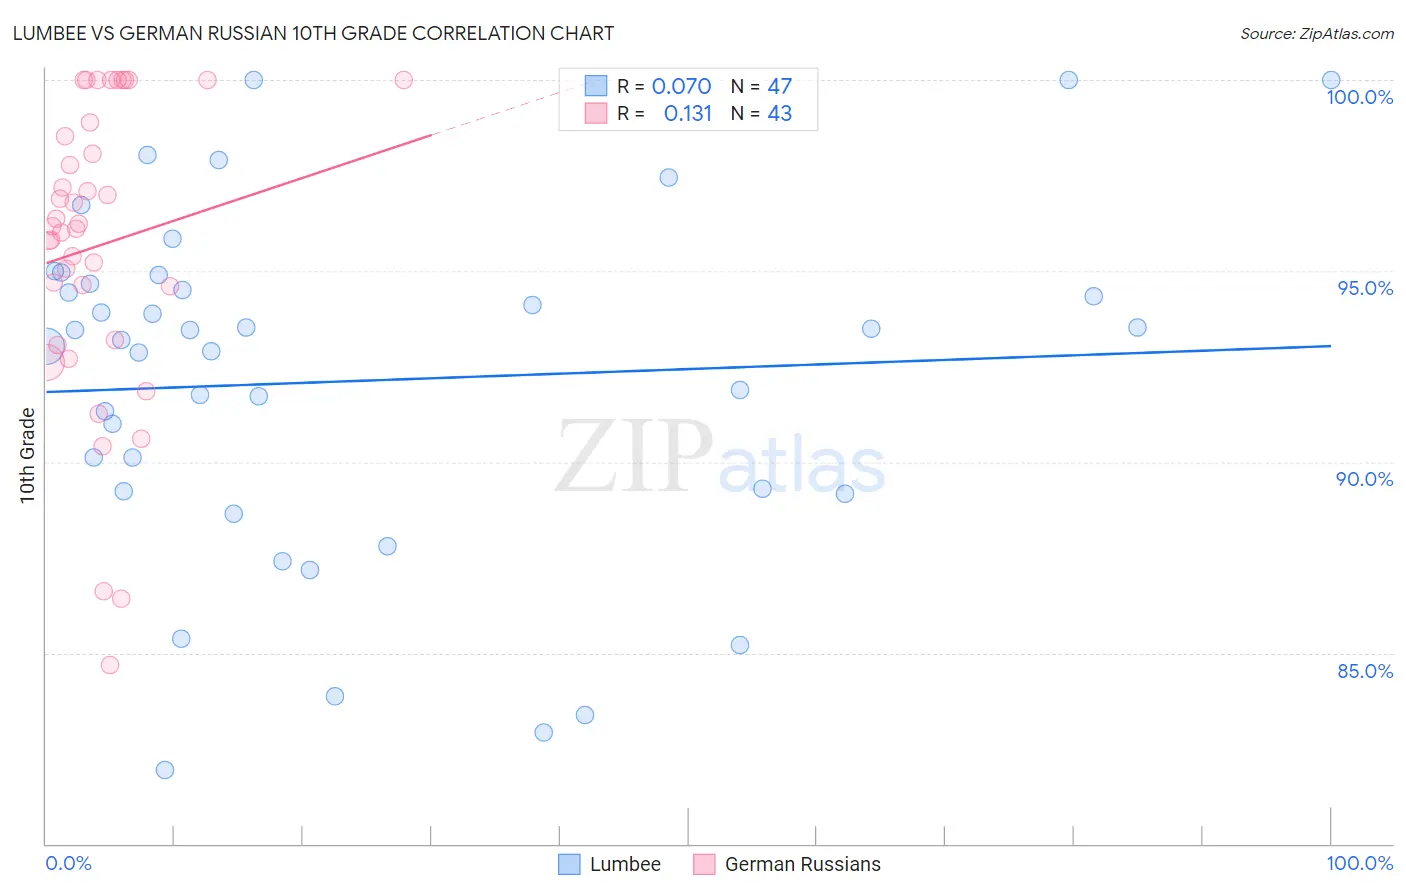
Lumbee vs German Russian 10th Grade Correlation Chart
The statistical analysis conducted on geographies consisting of 92,299,110 people shows a slight positive correlation between the proportion of Lumbee and percentage of population with at least 10th grade education in the United States with a correlation coefficient (R) of 0.070 and weighted average of 91.7%. Similarly, the statistical analysis conducted on geographies consisting of 96,461,984 people shows a poor positive correlation between the proportion of German Russians and percentage of population with at least 10th grade education in the United States with a correlation coefficient (R) of 0.131 and weighted average of 94.4%, a difference of 2.9%.
10th Grade Correlation Summary
| Measurement | Lumbee | German Russian |
| Minimum | 81.9% | 84.7% |
| Maximum | 100.0% | 100.0% |
| Range | 18.1% | 15.3% |
| Mean | 92.1% | 95.7% |
| Median | 93.2% | 96.2% |
| Interquartile 25% (IQ1) | 89.2% | 93.2% |
| Interquartile 75% (IQ3) | 94.7% | 98.9% |
| Interquartile Range (IQR) | 5.4% | 5.7% |
| Standard Deviation (Sample) | 4.5% | 3.9% |
| Standard Deviation (Population) | 4.4% | 3.8% |
Similar Demographics by 10th Grade
Demographics Similar to Lumbee by 10th Grade
In terms of 10th grade, the demographic groups most similar to Lumbee are Haitian (91.8%, a difference of 0.030%), Indonesian (91.8%, a difference of 0.060%), Immigrants from West Indies (91.8%, a difference of 0.080%), Immigrants from Burma/Myanmar (91.8%, a difference of 0.080%), and British West Indian (91.8%, a difference of 0.090%).
| Demographics | Rating | Rank | 10th Grade |
| Immigrants | Laos | 0.0 /100 | #288 | Tragic 91.9% |
| Sri Lankans | 0.0 /100 | #289 | Tragic 91.8% |
| British West Indians | 0.0 /100 | #290 | Tragic 91.8% |
| Immigrants | West Indies | 0.0 /100 | #291 | Tragic 91.8% |
| Immigrants | Burma/Myanmar | 0.0 /100 | #292 | Tragic 91.8% |
| Indonesians | 0.0 /100 | #293 | Tragic 91.8% |
| Haitians | 0.0 /100 | #294 | Tragic 91.8% |
| Lumbee | 0.0 /100 | #295 | Tragic 91.7% |
| Immigrants | Grenada | 0.0 /100 | #296 | Tragic 91.6% |
| Fijians | 0.0 /100 | #297 | Tragic 91.5% |
| Cubans | 0.0 /100 | #298 | Tragic 91.5% |
| Immigrants | Haiti | 0.0 /100 | #299 | Tragic 91.4% |
| Guyanese | 0.0 /100 | #300 | Tragic 91.4% |
| Japanese | 0.0 /100 | #301 | Tragic 91.2% |
| Immigrants | Guyana | 0.0 /100 | #302 | Tragic 91.2% |
Demographics Similar to German Russians by 10th Grade
In terms of 10th grade, the demographic groups most similar to German Russians are Delaware (94.4%, a difference of 0.0%), Sioux (94.4%, a difference of 0.0%), Palestinian (94.4%, a difference of 0.020%), Immigrants from Kuwait (94.4%, a difference of 0.030%), and Immigrants from Hungary (94.4%, a difference of 0.030%).
| Demographics | Rating | Rank | 10th Grade |
| Immigrants | Croatia | 97.4 /100 | #107 | Exceptional 94.5% |
| Immigrants | North Macedonia | 97.2 /100 | #108 | Exceptional 94.5% |
| Immigrants | Norway | 97.2 /100 | #109 | Exceptional 94.5% |
| Burmese | 97.1 /100 | #110 | Exceptional 94.5% |
| Immigrants | Zimbabwe | 96.8 /100 | #111 | Exceptional 94.4% |
| Immigrants | Kuwait | 96.8 /100 | #112 | Exceptional 94.4% |
| Palestinians | 96.5 /100 | #113 | Exceptional 94.4% |
| German Russians | 96.3 /100 | #114 | Exceptional 94.4% |
| Delaware | 96.3 /100 | #115 | Exceptional 94.4% |
| Sioux | 96.2 /100 | #116 | Exceptional 94.4% |
| Immigrants | Hungary | 95.8 /100 | #117 | Exceptional 94.4% |
| Jordanians | 95.6 /100 | #118 | Exceptional 94.4% |
| Immigrants | Israel | 95.4 /100 | #119 | Exceptional 94.4% |
| Immigrants | Taiwan | 95.3 /100 | #120 | Exceptional 94.4% |
| Immigrants | Belarus | 95.2 /100 | #121 | Exceptional 94.4% |