Lumbee vs Lebanese GED/Equivalency
COMPARE
Lumbee
Lebanese
GED/Equivalency
GED/Equivalency Comparison
Lumbee
Lebanese
80.0%
GED/EQUIVALENCY
0.0/ 100
METRIC RATING
322nd/ 347
METRIC RANK
87.2%
GED/EQUIVALENCY
96.2/ 100
METRIC RATING
102nd/ 347
METRIC RANK
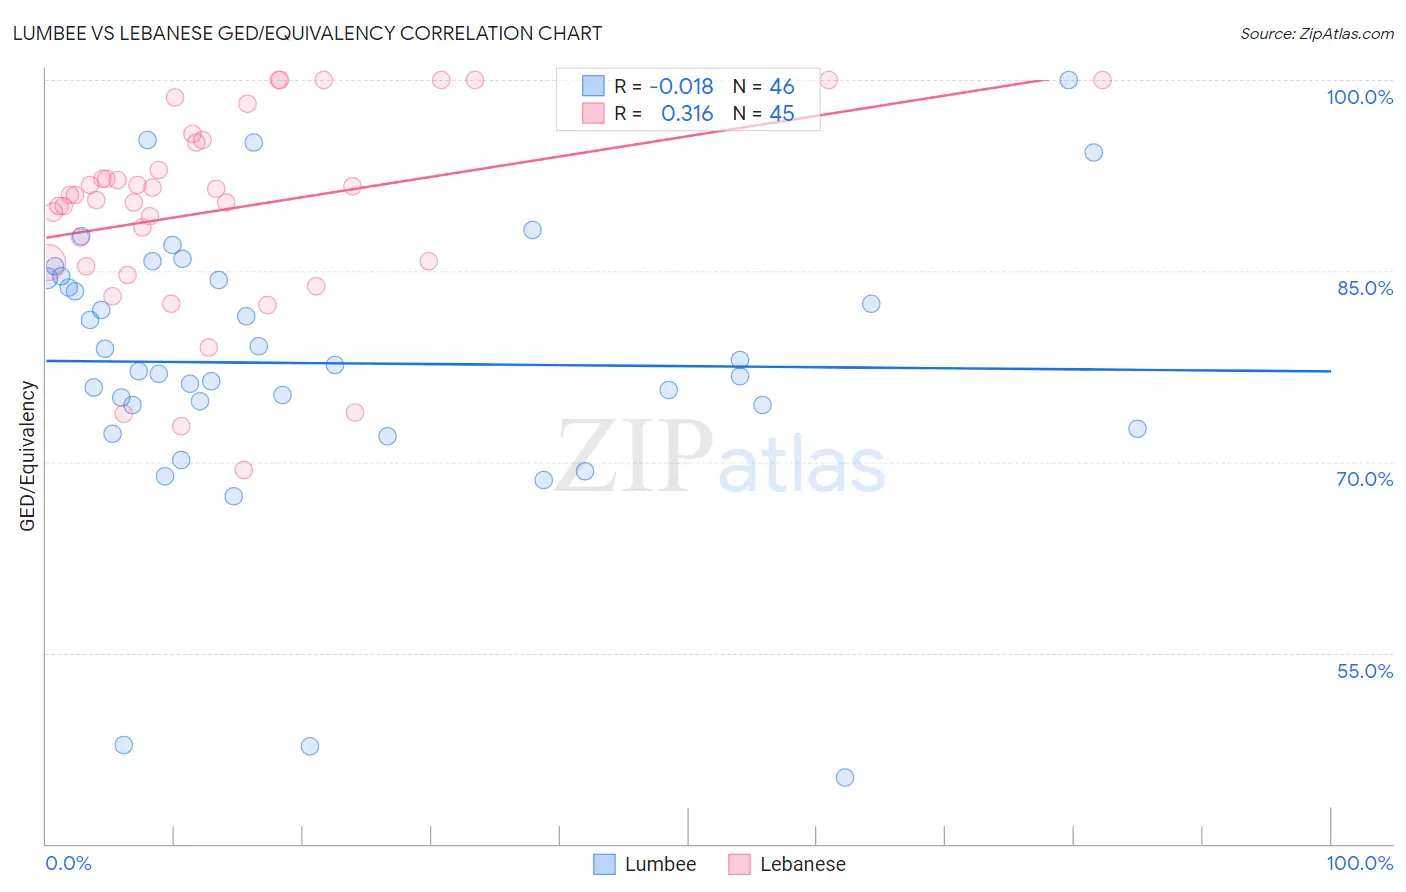
Lumbee vs Lebanese GED/Equivalency Correlation Chart
The statistical analysis conducted on geographies consisting of 92,299,068 people shows no correlation between the proportion of Lumbee and percentage of population with at least ged/equivalency education in the United States with a correlation coefficient (R) of -0.018 and weighted average of 80.0%. Similarly, the statistical analysis conducted on geographies consisting of 401,624,313 people shows a mild positive correlation between the proportion of Lebanese and percentage of population with at least ged/equivalency education in the United States with a correlation coefficient (R) of 0.316 and weighted average of 87.2%, a difference of 9.0%.
GED/Equivalency Correlation Summary
| Measurement | Lumbee | Lebanese |
| Minimum | 45.2% | 69.4% |
| Maximum | 100.0% | 100.0% |
| Range | 54.8% | 30.6% |
| Mean | 77.7% | 89.8% |
| Median | 77.4% | 90.9% |
| Interquartile 25% (IQ1) | 74.5% | 85.5% |
| Interquartile 75% (IQ3) | 84.4% | 95.2% |
| Interquartile Range (IQR) | 10.0% | 9.8% |
| Standard Deviation (Sample) | 11.1% | 7.7% |
| Standard Deviation (Population) | 11.0% | 7.6% |
Similar Demographics by GED/Equivalency
Demographics Similar to Lumbee by GED/Equivalency
In terms of ged/equivalency, the demographic groups most similar to Lumbee are Yup'ik (80.0%, a difference of 0.070%), Immigrants from Nicaragua (79.9%, a difference of 0.12%), Immigrants from Cuba (80.2%, a difference of 0.24%), Yaqui (80.5%, a difference of 0.65%), and Immigrants from Belize (80.5%, a difference of 0.65%).
| Demographics | Rating | Rank | GED/Equivalency |
| Apache | 0.0 /100 | #315 | Tragic 80.7% |
| Central American Indians | 0.0 /100 | #316 | Tragic 80.6% |
| Immigrants | Caribbean | 0.0 /100 | #317 | Tragic 80.5% |
| Yaqui | 0.0 /100 | #318 | Tragic 80.5% |
| Immigrants | Belize | 0.0 /100 | #319 | Tragic 80.5% |
| Immigrants | Cuba | 0.0 /100 | #320 | Tragic 80.2% |
| Yup'ik | 0.0 /100 | #321 | Tragic 80.0% |
| Lumbee | 0.0 /100 | #322 | Tragic 80.0% |
| Immigrants | Nicaragua | 0.0 /100 | #323 | Tragic 79.9% |
| Mexican American Indians | 0.0 /100 | #324 | Tragic 79.4% |
| Hondurans | 0.0 /100 | #325 | Tragic 79.3% |
| Yuman | 0.0 /100 | #326 | Tragic 79.2% |
| Central Americans | 0.0 /100 | #327 | Tragic 79.2% |
| Hispanics or Latinos | 0.0 /100 | #328 | Tragic 79.1% |
| Dominicans | 0.0 /100 | #329 | Tragic 79.1% |
Demographics Similar to Lebanese by GED/Equivalency
In terms of ged/equivalency, the demographic groups most similar to Lebanese are Jordanian (87.2%, a difference of 0.010%), Immigrants from Hungary (87.2%, a difference of 0.020%), Indian (Asian) (87.1%, a difference of 0.030%), Immigrants from Zimbabwe (87.1%, a difference of 0.050%), and Syrian (87.2%, a difference of 0.060%).
| Demographics | Rating | Rank | GED/Equivalency |
| Immigrants | Greece | 97.7 /100 | #95 | Exceptional 87.4% |
| Czechoslovakians | 97.6 /100 | #96 | Exceptional 87.4% |
| Immigrants | Western Europe | 97.3 /100 | #97 | Exceptional 87.3% |
| Immigrants | Croatia | 96.9 /100 | #98 | Exceptional 87.3% |
| Immigrants | Belarus | 96.9 /100 | #99 | Exceptional 87.3% |
| Palestinians | 96.8 /100 | #100 | Exceptional 87.3% |
| Syrians | 96.6 /100 | #101 | Exceptional 87.2% |
| Lebanese | 96.2 /100 | #102 | Exceptional 87.2% |
| Jordanians | 96.1 /100 | #103 | Exceptional 87.2% |
| Immigrants | Hungary | 96.0 /100 | #104 | Exceptional 87.2% |
| Indians (Asian) | 95.9 /100 | #105 | Exceptional 87.1% |
| Immigrants | Zimbabwe | 95.8 /100 | #106 | Exceptional 87.1% |
| Icelanders | 95.7 /100 | #107 | Exceptional 87.1% |
| Canadians | 95.6 /100 | #108 | Exceptional 87.1% |
| Immigrants | Eastern Europe | 95.5 /100 | #109 | Exceptional 87.1% |