Creek vs Immigrants from Syria No Schooling Completed
COMPARE
Creek
Immigrants from Syria
No Schooling Completed
No Schooling Completed Comparison
Creek
Immigrants from Syria
1.6%
NO SCHOOLING COMPLETED
99.8/ 100
METRIC RATING
53rd/ 347
METRIC RANK
2.3%
NO SCHOOLING COMPLETED
6.6/ 100
METRIC RATING
217th/ 347
METRIC RANK
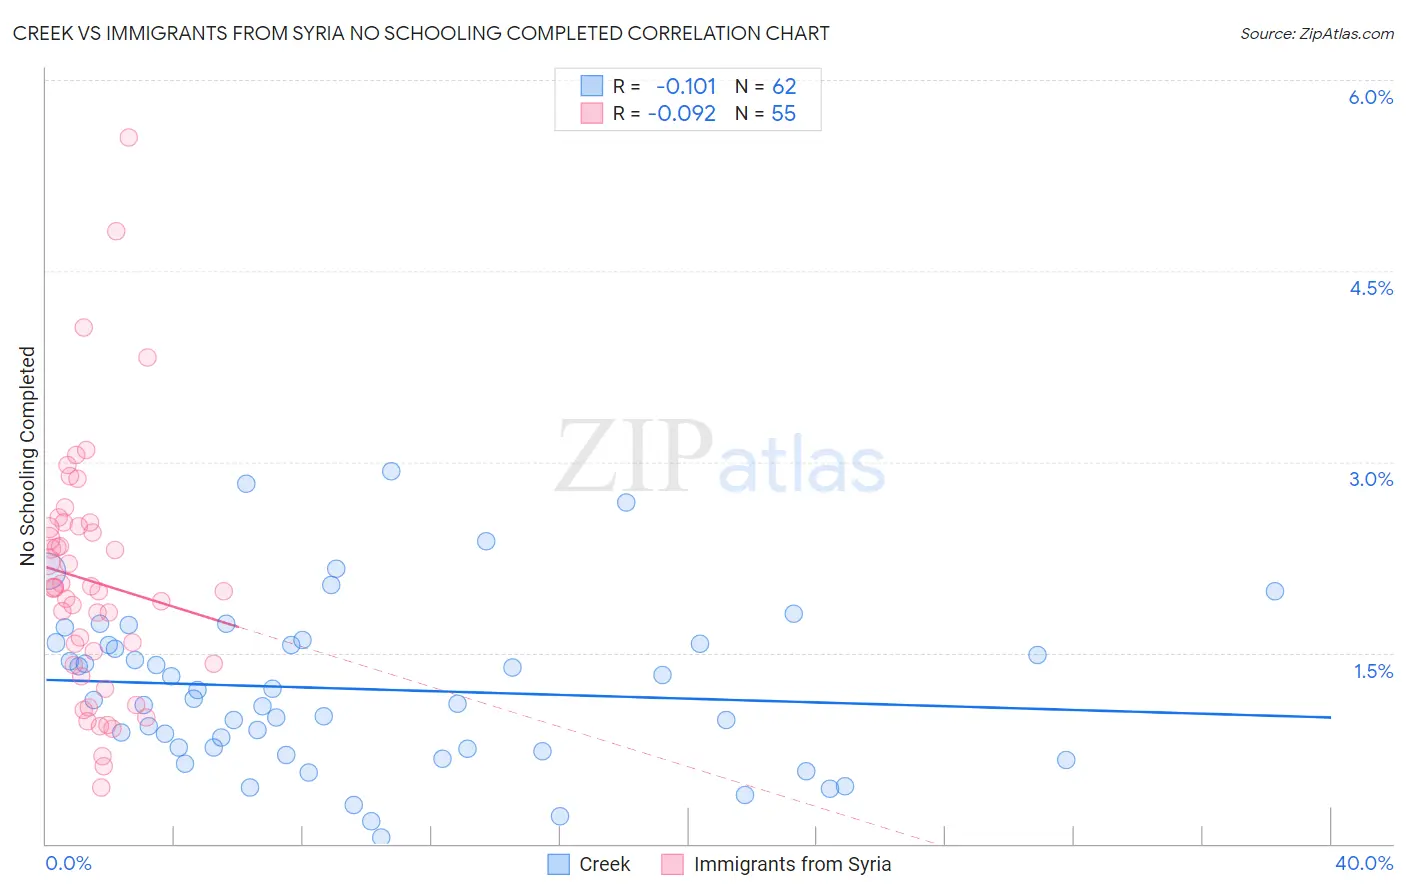
Creek vs Immigrants from Syria No Schooling Completed Correlation Chart
The statistical analysis conducted on geographies consisting of 177,524,954 people shows a poor negative correlation between the proportion of Creek and percentage of population with no schooling in the United States with a correlation coefficient (R) of -0.101 and weighted average of 1.6%. Similarly, the statistical analysis conducted on geographies consisting of 173,620,316 people shows a slight negative correlation between the proportion of Immigrants from Syria and percentage of population with no schooling in the United States with a correlation coefficient (R) of -0.092 and weighted average of 2.3%, a difference of 38.9%.
No Schooling Completed Correlation Summary
| Measurement | Creek | Immigrants from Syria |
| Minimum | 0.049% | 0.44% |
| Maximum | 2.9% | 5.6% |
| Range | 2.9% | 5.1% |
| Mean | 1.2% | 2.1% |
| Median | 1.1% | 2.0% |
| Interquartile 25% (IQ1) | 0.74% | 1.4% |
| Interquartile 75% (IQ3) | 1.6% | 2.5% |
| Interquartile Range (IQR) | 0.82% | 1.1% |
| Standard Deviation (Sample) | 0.64% | 0.98% |
| Standard Deviation (Population) | 0.64% | 0.97% |
Similar Demographics by No Schooling Completed
Demographics Similar to Creek by No Schooling Completed
In terms of no schooling completed, the demographic groups most similar to Creek are Crow (1.6%, a difference of 0.030%), Immigrants from Canada (1.6%, a difference of 0.13%), Greek (1.6%, a difference of 0.15%), Immigrants from North America (1.6%, a difference of 0.15%), and Chippewa (1.6%, a difference of 0.20%).
| Demographics | Rating | Rank | No Schooling Completed |
| Maltese | 99.9 /100 | #46 | Exceptional 1.6% |
| Ottawa | 99.9 /100 | #47 | Exceptional 1.6% |
| Immigrants | Scotland | 99.9 /100 | #48 | Exceptional 1.6% |
| Whites/Caucasians | 99.9 /100 | #49 | Exceptional 1.6% |
| Celtics | 99.9 /100 | #50 | Exceptional 1.6% |
| Chippewa | 99.8 /100 | #51 | Exceptional 1.6% |
| Immigrants | Canada | 99.8 /100 | #52 | Exceptional 1.6% |
| Creek | 99.8 /100 | #53 | Exceptional 1.6% |
| Crow | 99.8 /100 | #54 | Exceptional 1.6% |
| Greeks | 99.8 /100 | #55 | Exceptional 1.6% |
| Immigrants | North America | 99.8 /100 | #56 | Exceptional 1.6% |
| Austrians | 99.8 /100 | #57 | Exceptional 1.6% |
| Kiowa | 99.8 /100 | #58 | Exceptional 1.6% |
| Slavs | 99.8 /100 | #59 | Exceptional 1.7% |
| Americans | 99.8 /100 | #60 | Exceptional 1.7% |
Demographics Similar to Immigrants from Syria by No Schooling Completed
In terms of no schooling completed, the demographic groups most similar to Immigrants from Syria are Tongan (2.3%, a difference of 0.090%), Immigrants from Nepal (2.3%, a difference of 0.11%), Immigrants from Zaire (2.3%, a difference of 0.28%), Senegalese (2.3%, a difference of 0.55%), and Samoan (2.3%, a difference of 0.72%).
| Demographics | Rating | Rank | No Schooling Completed |
| Natives/Alaskans | 10.0 /100 | #210 | Tragic 2.2% |
| Immigrants | Panama | 8.8 /100 | #211 | Tragic 2.3% |
| Immigrants | Morocco | 8.7 /100 | #212 | Tragic 2.3% |
| Ute | 8.2 /100 | #213 | Tragic 2.3% |
| Samoans | 8.2 /100 | #214 | Tragic 2.3% |
| Immigrants | Zaire | 7.2 /100 | #215 | Tragic 2.3% |
| Tongans | 6.8 /100 | #216 | Tragic 2.3% |
| Immigrants | Syria | 6.6 /100 | #217 | Tragic 2.3% |
| Immigrants | Nepal | 6.4 /100 | #218 | Tragic 2.3% |
| Senegalese | 5.6 /100 | #219 | Tragic 2.3% |
| Immigrants | Costa Rica | 5.1 /100 | #220 | Tragic 2.3% |
| Immigrants | Sudan | 5.0 /100 | #221 | Tragic 2.3% |
| Sub-Saharan Africans | 4.7 /100 | #222 | Tragic 2.3% |
| Immigrants | Lebanon | 4.5 /100 | #223 | Tragic 2.3% |
| Tohono O'odham | 4.1 /100 | #224 | Tragic 2.3% |